
Image prompt setAdded 2026-08-21Free
The images
50 in this set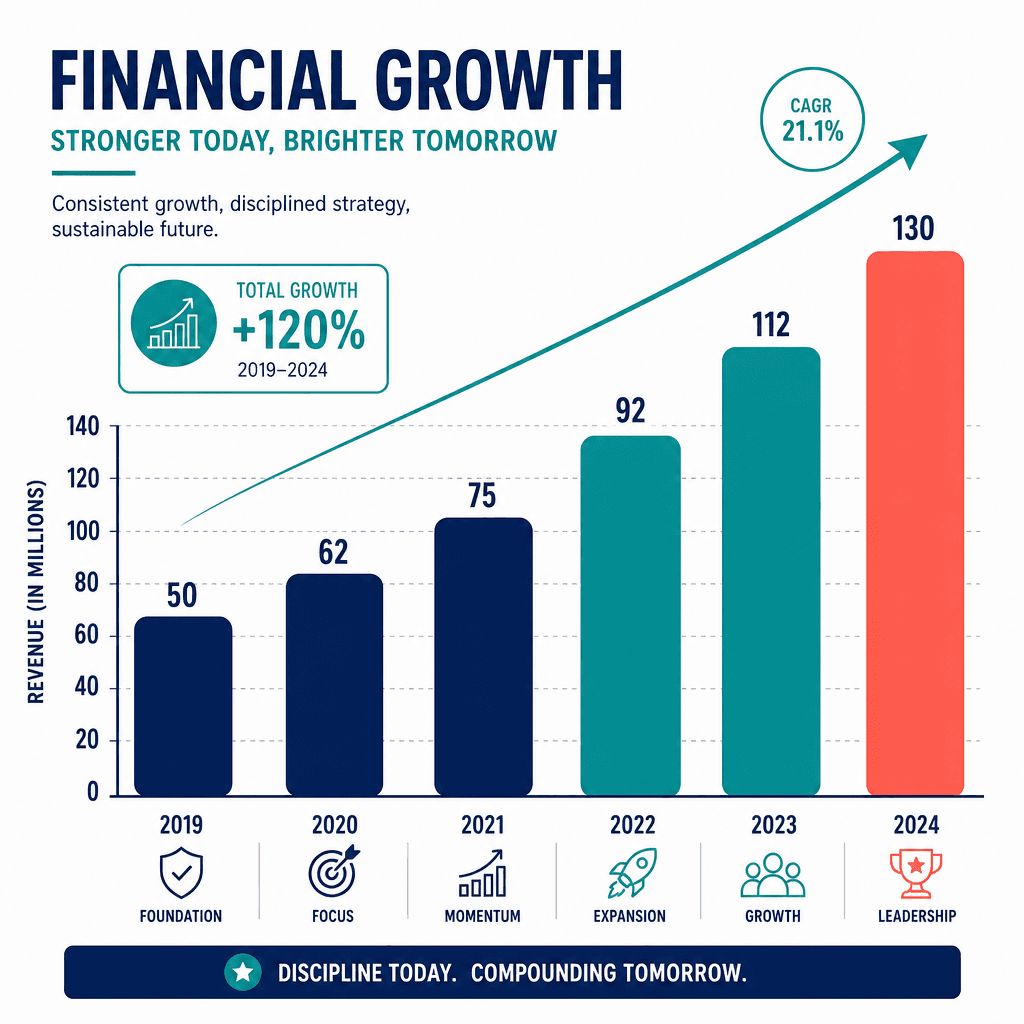
Prompt 1Flat vector infographic of a clean vertical bar chart showing financial growth, bold rounded bars ascending left to right with a subtle trend arrow, minimal grid lines, decorative placeholder labels. Even editorial lighting, crisp solid fills, no gradients, modern data-journalism style. Confident analytical mood, deep-navy and teal with a coral accent. Square 1:1, generous whitespace, sharp vector edges, high resolution. 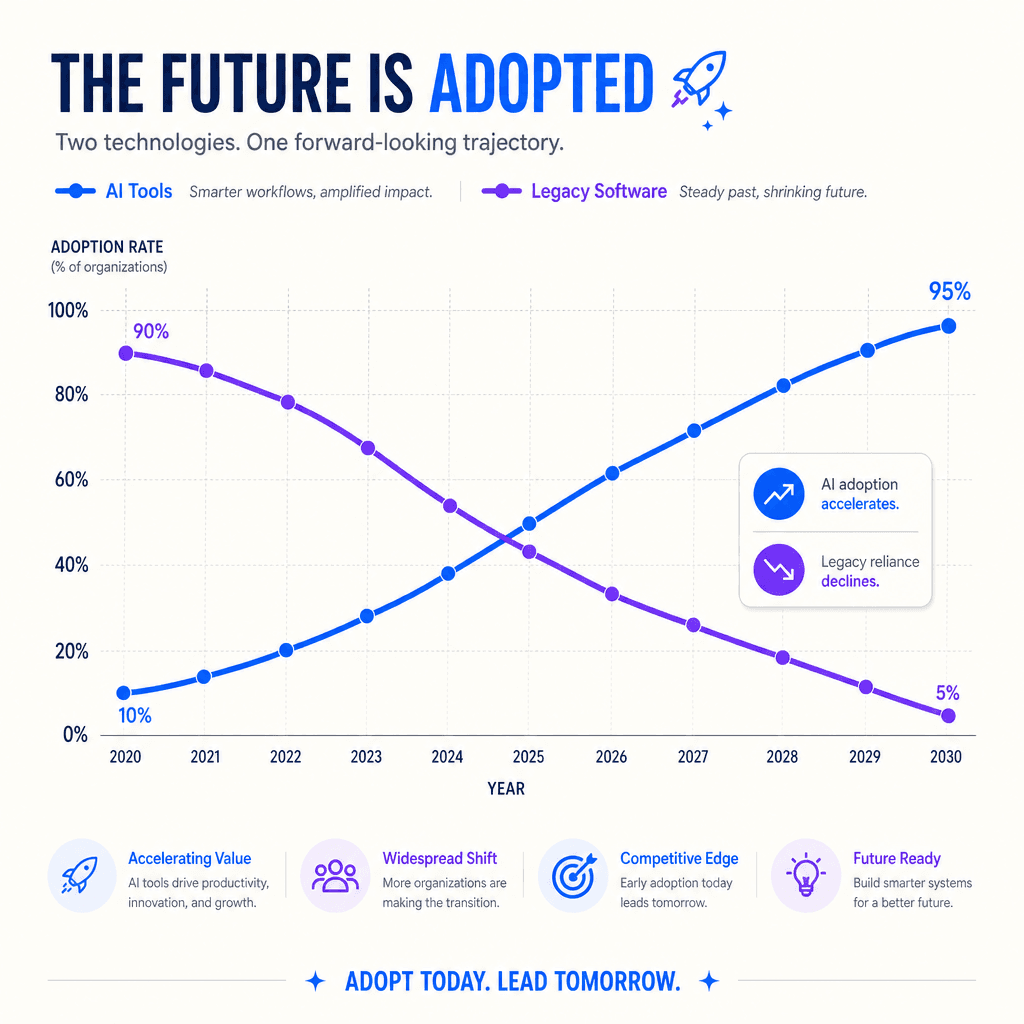
Prompt 2Flat vector infographic of a smooth multi-line trend chart for tech adoption, two crossing lines with soft dot markers and a faint gridded backdrop, tiny decorative axis labels. Bright even light, crisp flat fills, clean editorial style. Forward-looking optimistic mood, electric-blue and violet on off-white. Square 1:1, balanced composition, sharp edges, airy margins, high resolution. 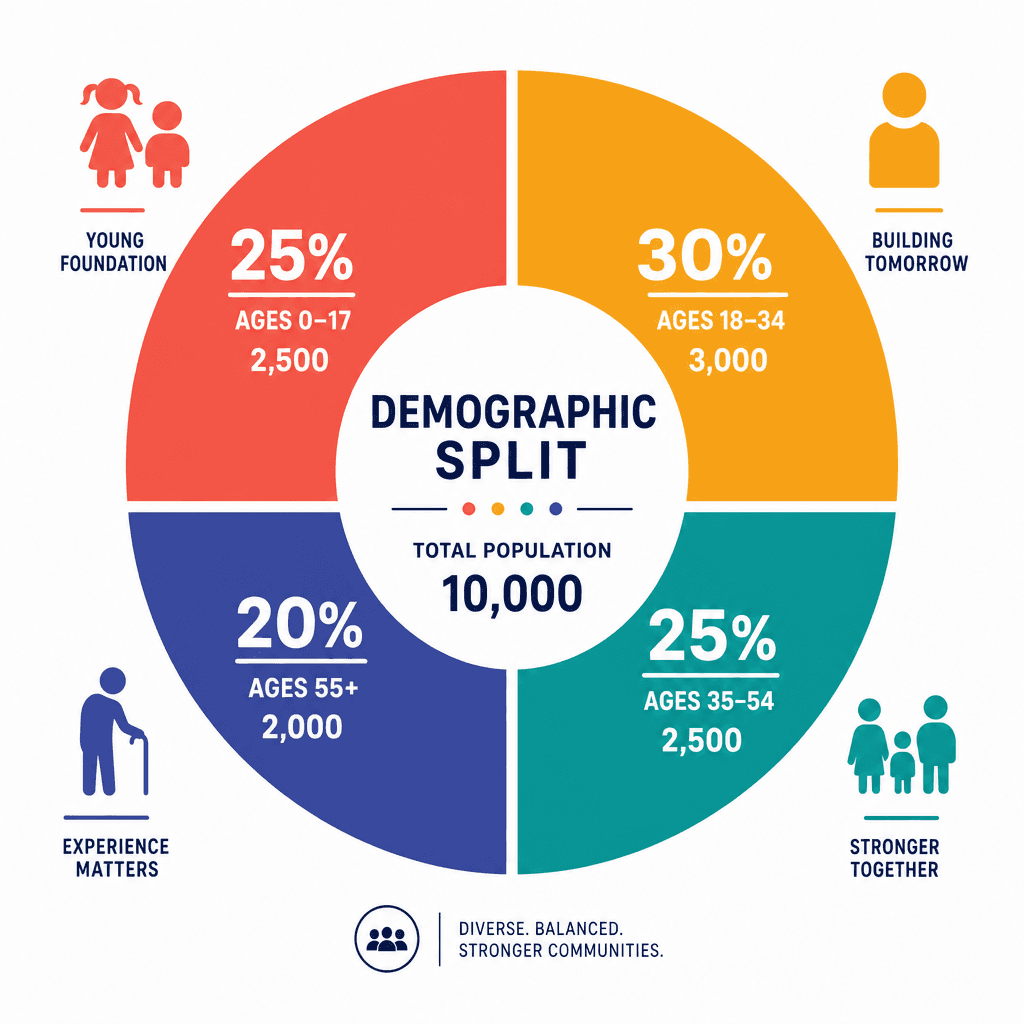
Prompt 3Flat vector infographic of a segmented donut chart showing demographic split, bold evenly-weighted arcs with a clean center label area, small icon accents around it. Even studio light, solid color blocks, no shading, modern report style. Clear informative mood, warm spectrum of coral, amber, teal, and indigo. Square 1:1, centered, crisp vector edges, generous whitespace, high resolution. 
Prompt 4Flat vector infographic of a social network node graph, interconnected circular nodes of varying sizes linked by thin clean lines, clustered communities in distinct colors. Even diffused light, flat solid fills, minimal modern style. Connected dynamic mood, magenta, teal, and slate on pale grey. Square 1:1, balanced organic layout, sharp edges, airy negative space, high resolution. 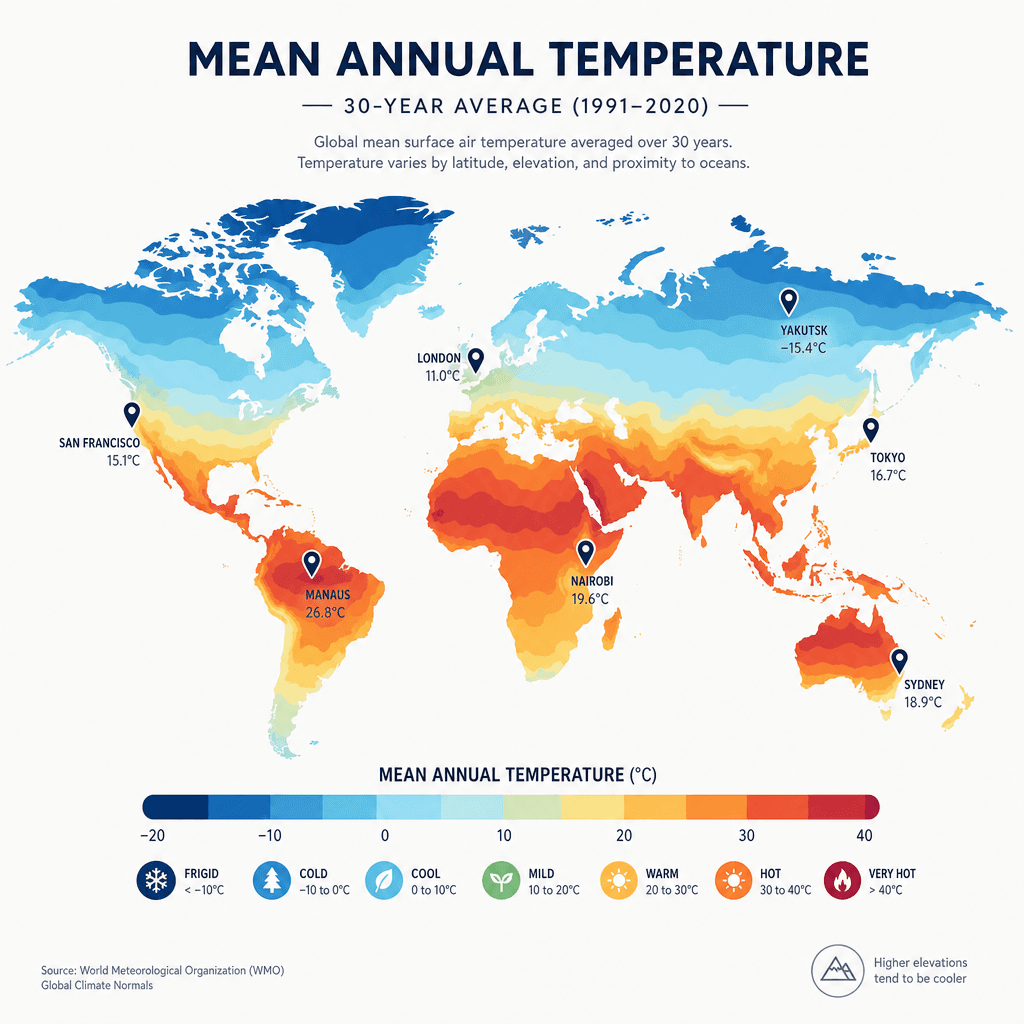
Prompt 5Flat vector infographic of a choropleth world map shaded by climate data, smooth simplified continents in graduated tones, a tidy legend strip and small marker pins. Even editorial light, crisp flat fills, clean data-viz style. Serious global mood, cool blue-to-amber gradient scale on soft white. Square 1:1, centered map, sharp vector edges, generous margins, high resolution. 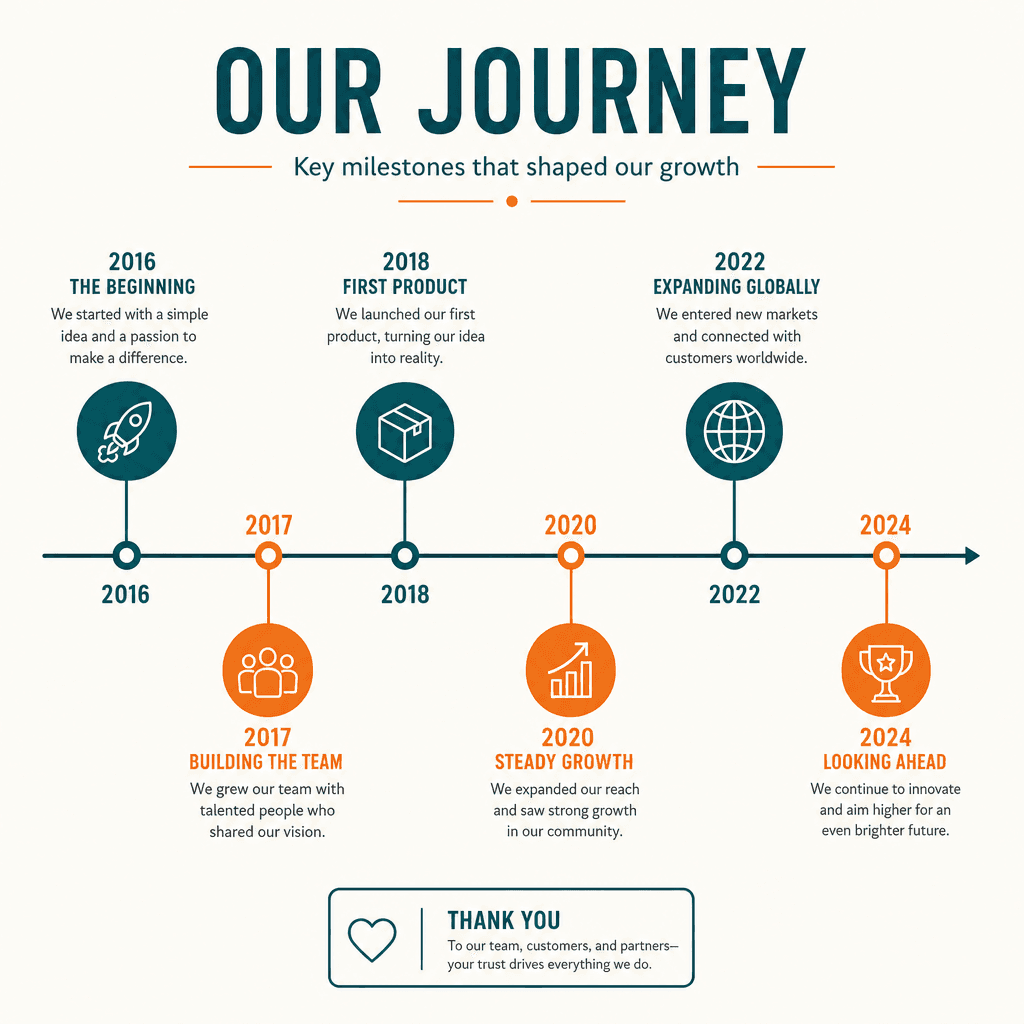
Prompt 6Flat vector infographic timeline running horizontally with evenly spaced milestone dots, alternating caption blocks above and below a central line, small circular icons. Even light, crisp solid fills, clean editorial style. Orderly progressive mood, deep-teal and warm-orange on off-white. Square 1:1, balanced symmetry, sharp edges, airy whitespace, high-resolution infographic presentation. 
Prompt 7Flat vector infographic of a marketing funnel, four stacked tapering bands narrowing downward with small step icons and decorative percentage labels. Even studio light, bold solid color blocks, no gradients, modern report style. Persuasive structured mood, indigo-to-cyan gradient of solid bands on pale grey. Square 1:1, centered, crisp vector edges, generous whitespace, high resolution. 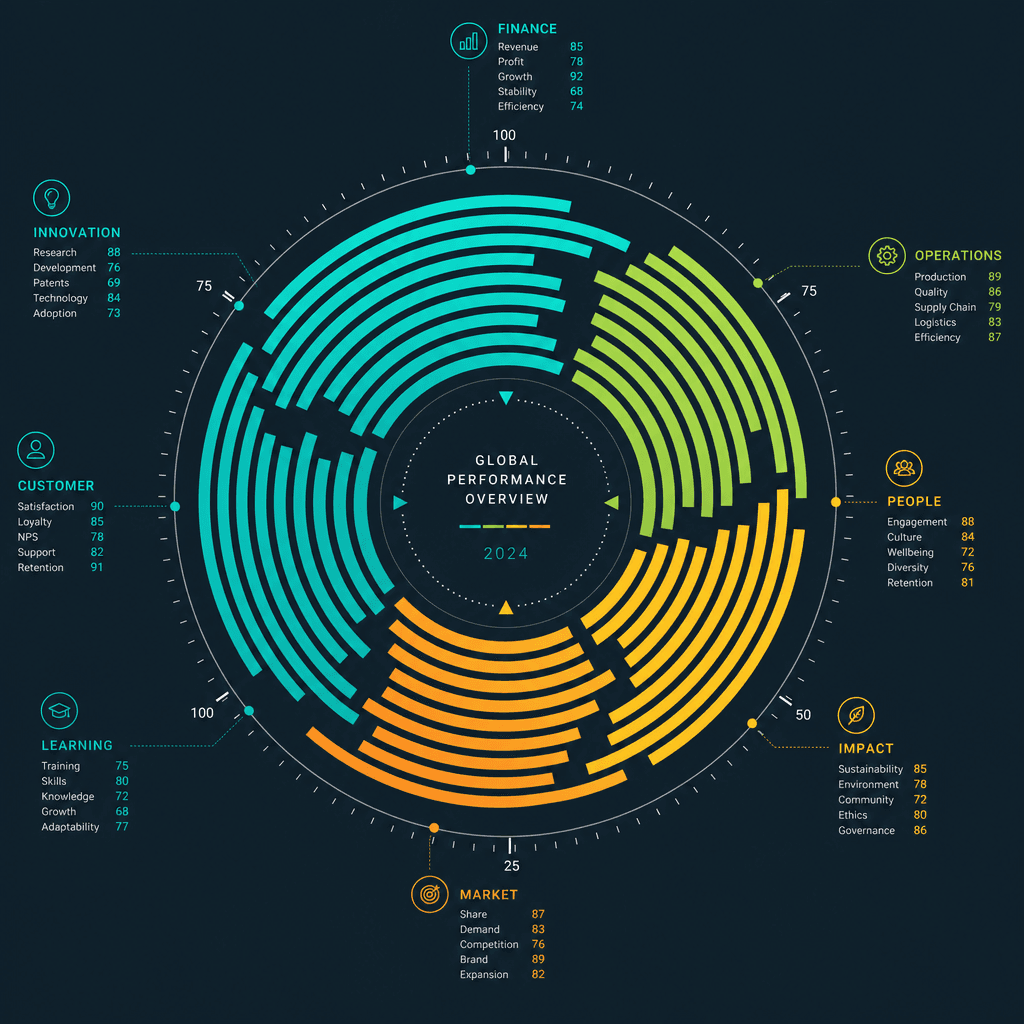
Prompt 8Flat vector infographic of a radial circular bar chart, concentric arcs of varying length radiating from a central hub, thin tick marks and tiny decorative labels. Even diffused light, crisp flat fills, sleek modern style. Elegant analytical mood, gradient of teal, lime, and amber on dark slate. Square 1:1, centered, sharp edges, balanced negative space, high resolution. 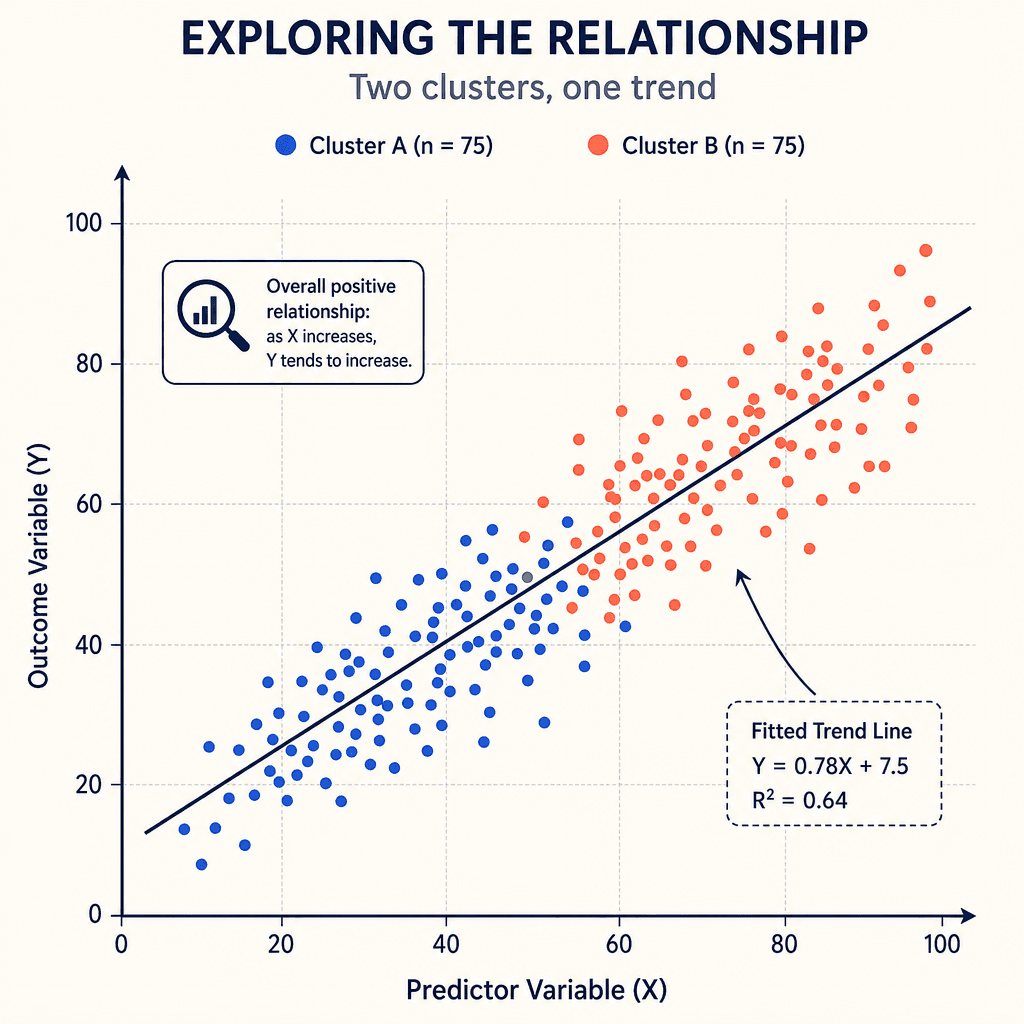
Prompt 9Flat vector infographic of a scatter plot with a fitted trend line, scattered dot clusters of two colors over a faint grid, small decorative axis ticks. Bright even light, crisp solid fills, clean scientific style. Curious investigative mood, cobalt and coral dots on off-white. Square 1:1, balanced composition, sharp vector edges, generous margins, high resolution. 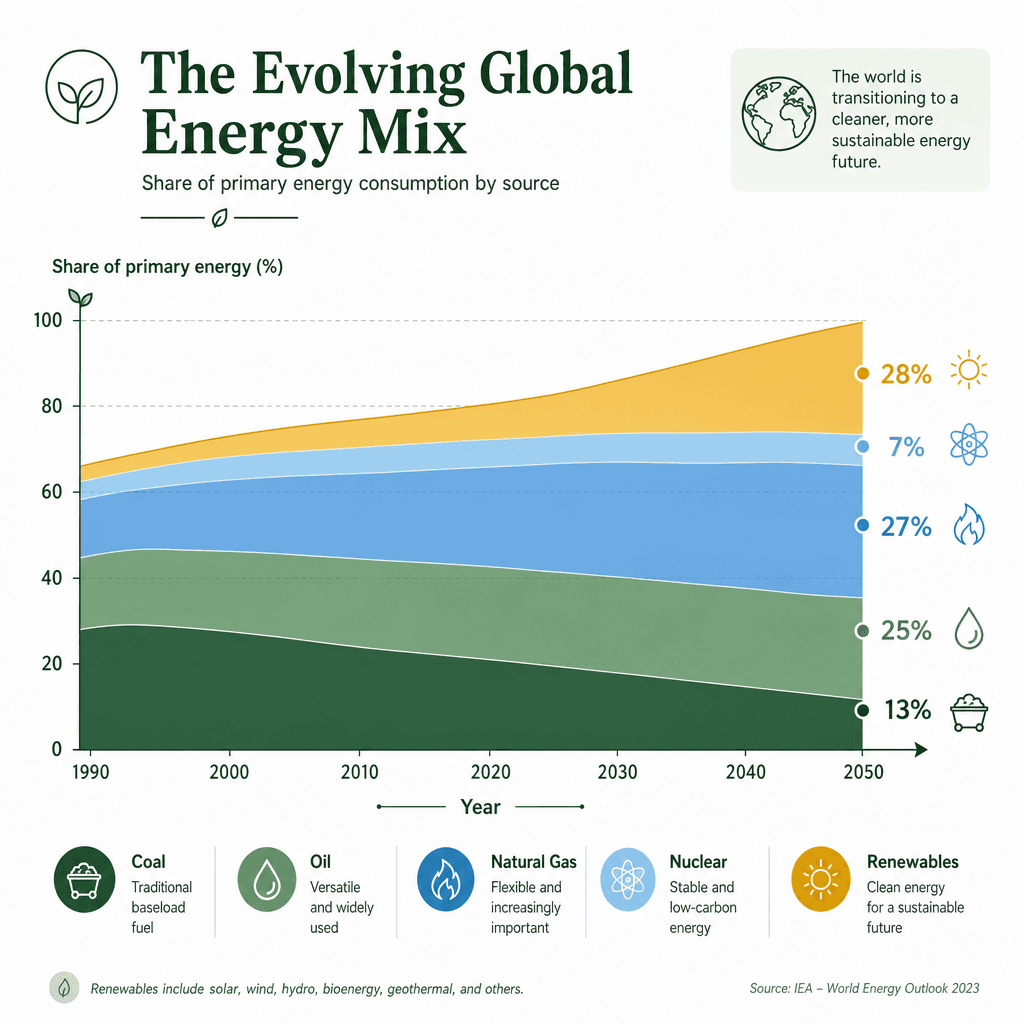
Prompt 10Flat vector infographic of a layered area chart showing energy mix, overlapping translucent bands stacked along a baseline with a tidy legend, decorative axis labels. Even editorial light, smooth flat fills, modern data-journalism style. Calm informative mood, forest-green, sky-blue, and gold on soft white. Square 1:1, balanced layout, sharp edges, airy whitespace, high resolution. 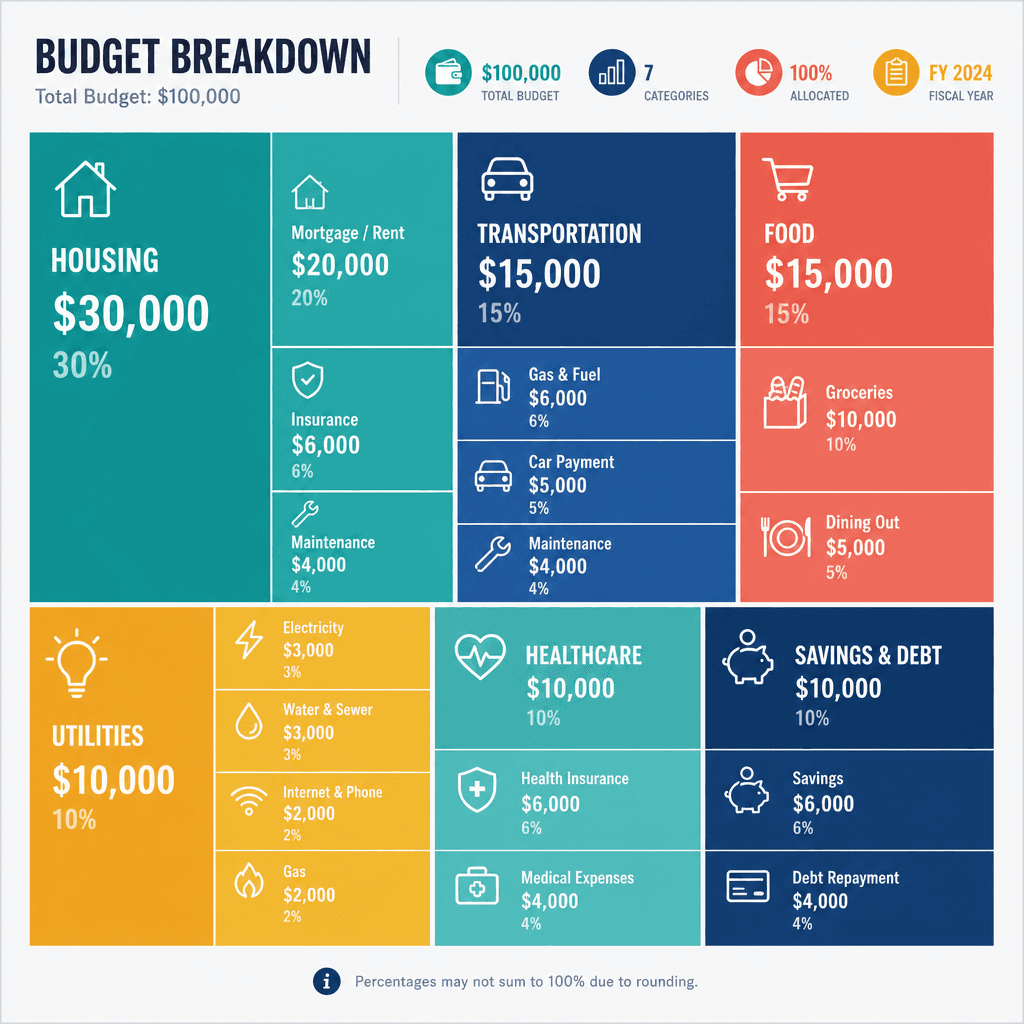
Prompt 11Flat vector infographic of a treemap budget breakdown, nested rectangles of varying size in distinct flat colors with small decorative category labels. Even studio light, crisp solid fills, clean dashboard style. Organized analytical mood, balanced palette of teal, navy, coral, and amber. Square 1:1, tightly packed grid, sharp vector edges, generous outer margin, high resolution. 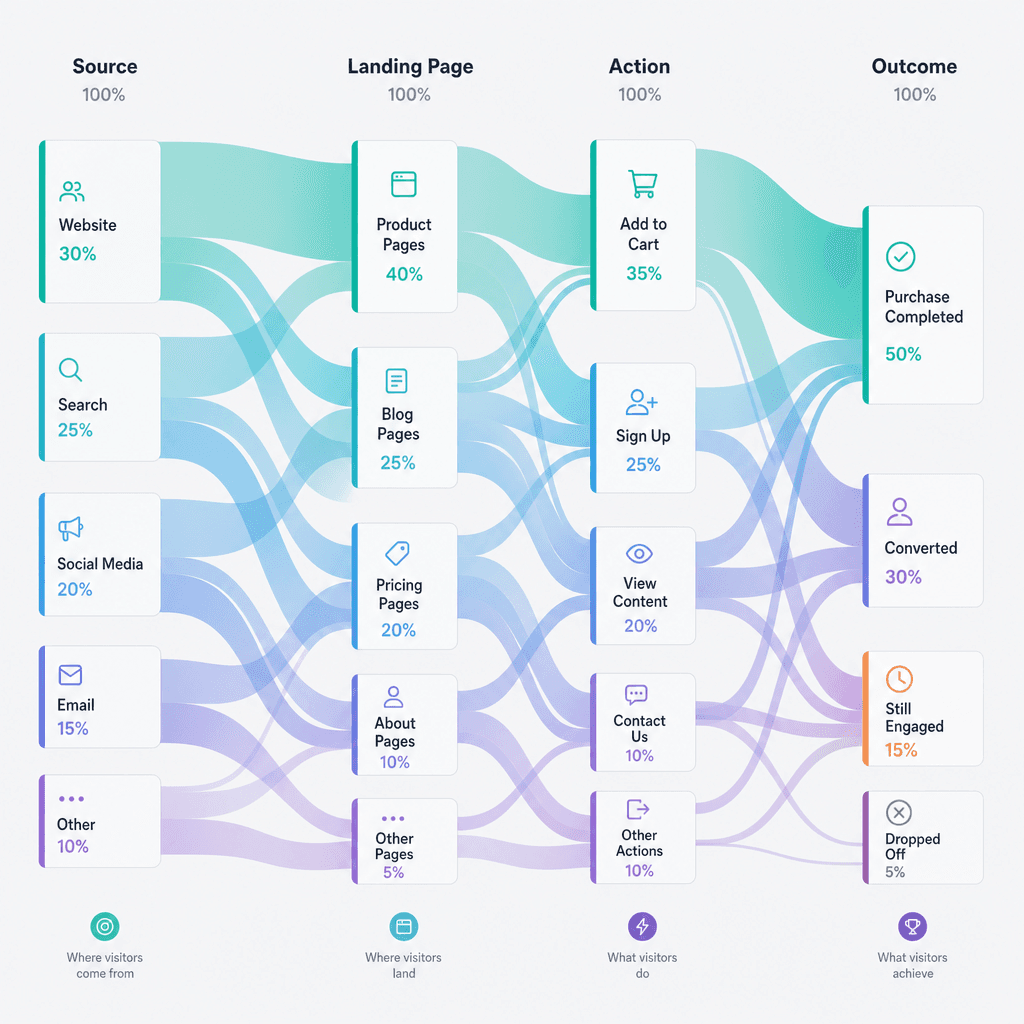
Prompt 12Flat vector infographic of a Sankey flow diagram, smooth ribbon streams splitting and merging between labeled columns, soft translucent flows in graduated colors. Even diffused light, clean flat style, modern data-viz aesthetic. Fluid systematic mood, teal-to-violet ribbon gradient on pale grey. Square 1:1, balanced left-to-right flow, crisp edges, airy margins, high resolution. 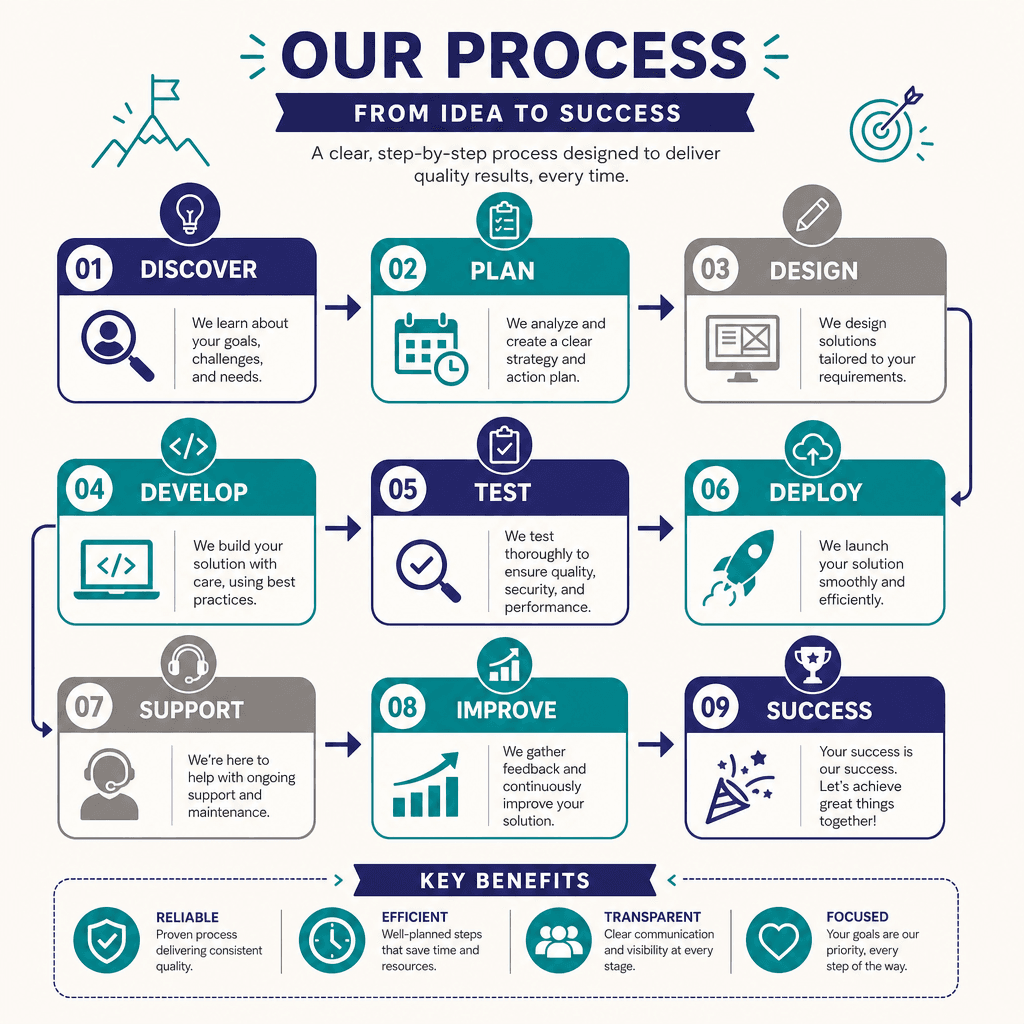
Prompt 13Flat vector infographic process flowchart, rounded rectangular steps connected by clean directional arrows with small node icons and decorative labels. Even light, bold solid fills, no gradients, modern editorial style. Logical clear mood, indigo, teal, and warm-grey on off-white. Square 1:1, balanced grid layout, sharp vector edges, generous whitespace, high-resolution infographic presentation. 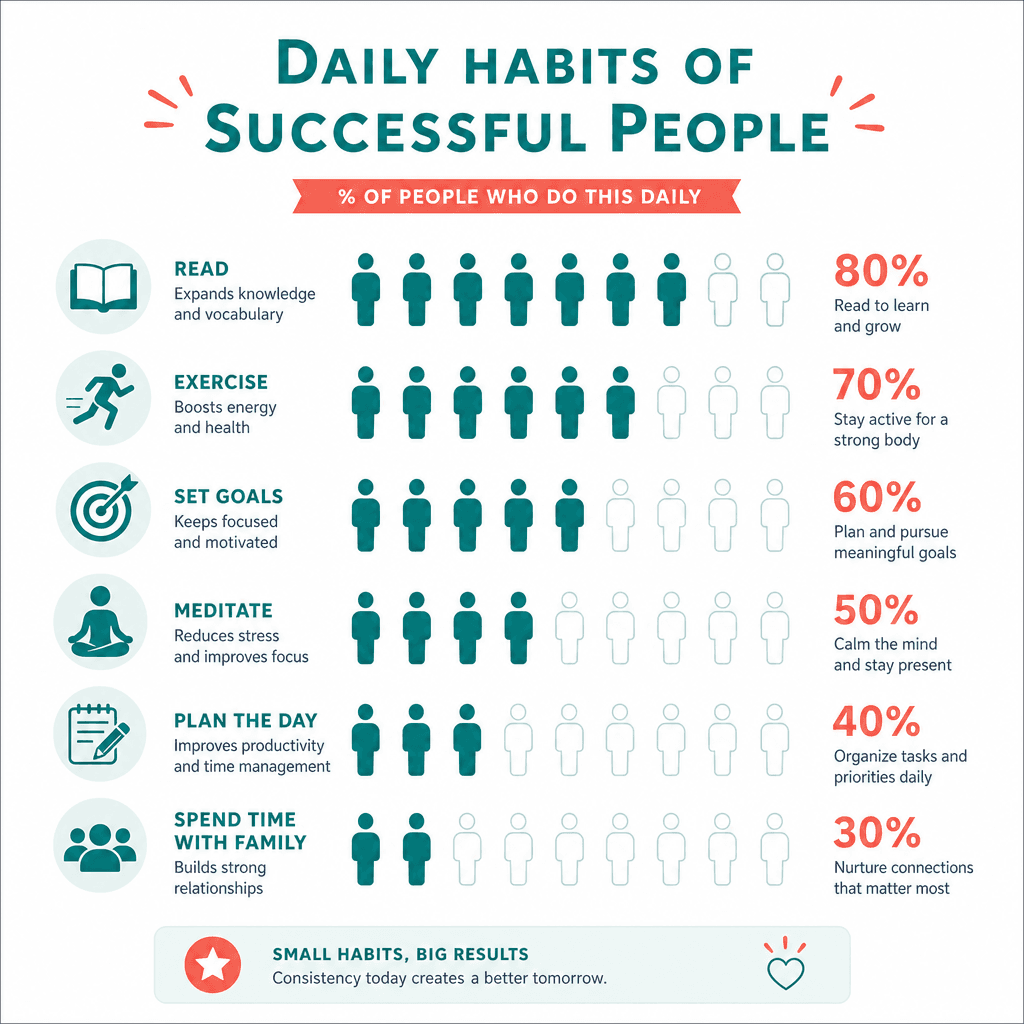
Prompt 14Flat vector pictogram infographic, a grid of repeated simple icons filled to varying levels to represent statistics, with small decorative captions. Bright even light, crisp solid fills, clean isotype style. Friendly informative mood, teal and coral icons on soft white. Square 1:1, neat aligned grid, sharp edges, generous margins, high-resolution data presentation. 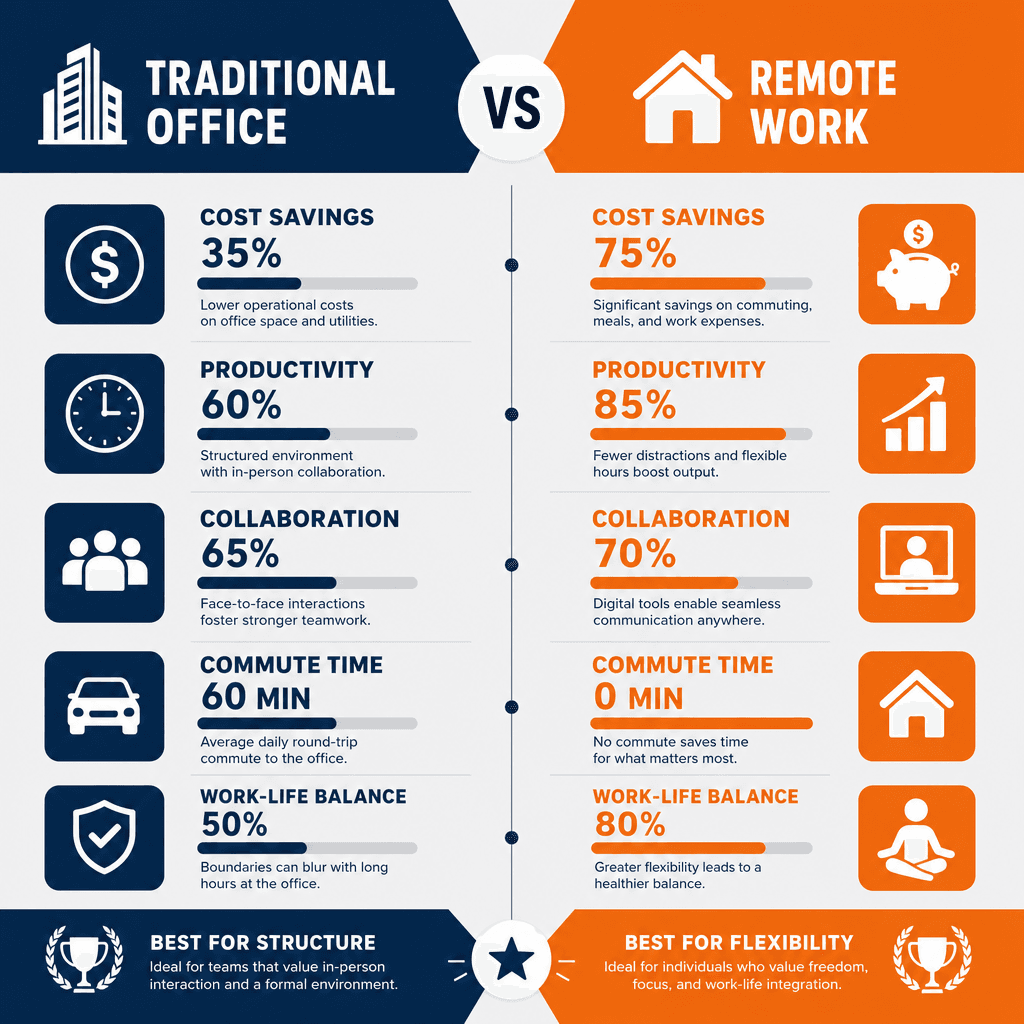
Prompt 15Flat vector versus comparison infographic, a clean split layout with two mirrored columns of stat blocks, small icons, and bar accents divided by a central line. Even studio light, bold solid fills, modern report style. Balanced decisive mood, deep-navy versus warm-orange on pale grey. Square 1:1, symmetrical composition, sharp vector edges, airy whitespace, high resolution. 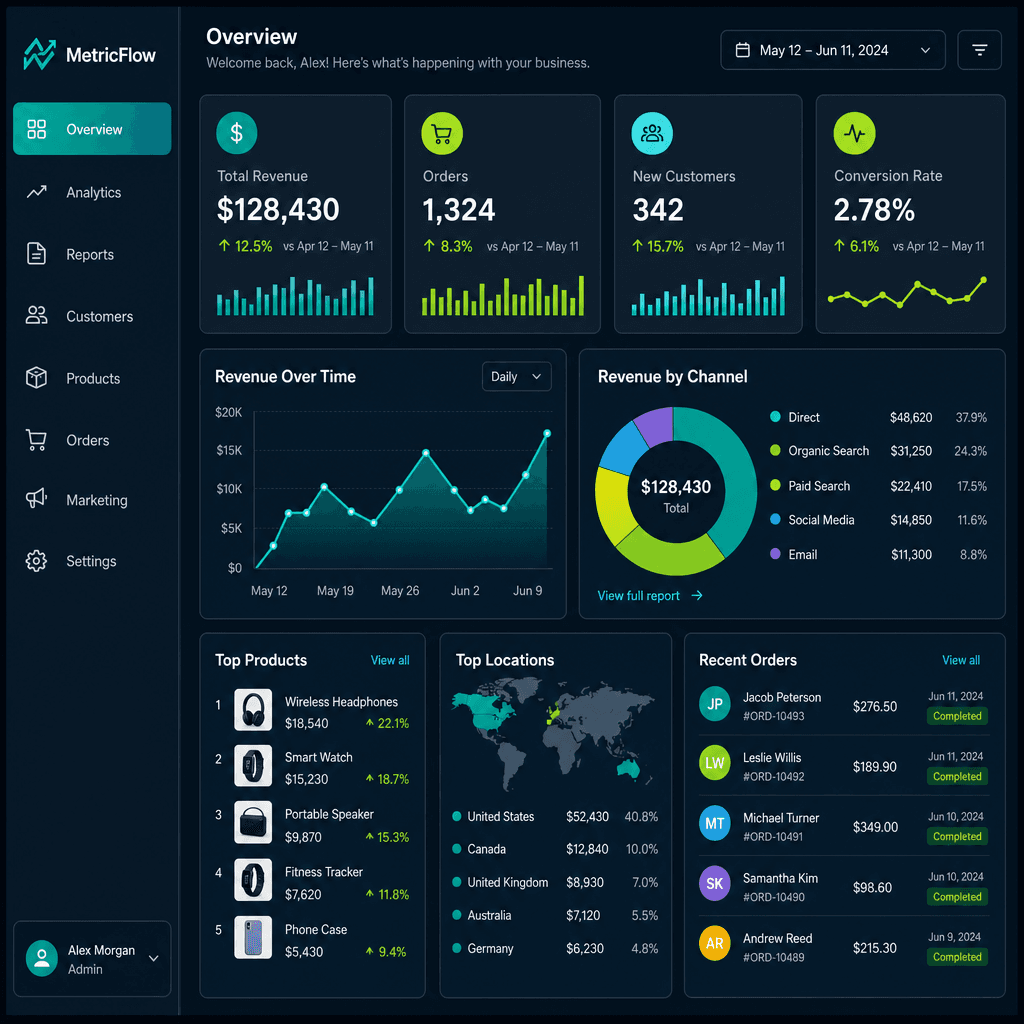
Prompt 16Flat vector dashboard-style infographic, a tidy grid of mixed mini-charts -- a small bar, a donut, a line spark, and KPI stat tiles -- with decorative labels. Even light, crisp solid fills, sleek modern UI style. Organized confident mood, dark-slate panels with teal and lime accents. Square 1:1, neat card grid, sharp edges, balanced spacing, high resolution. 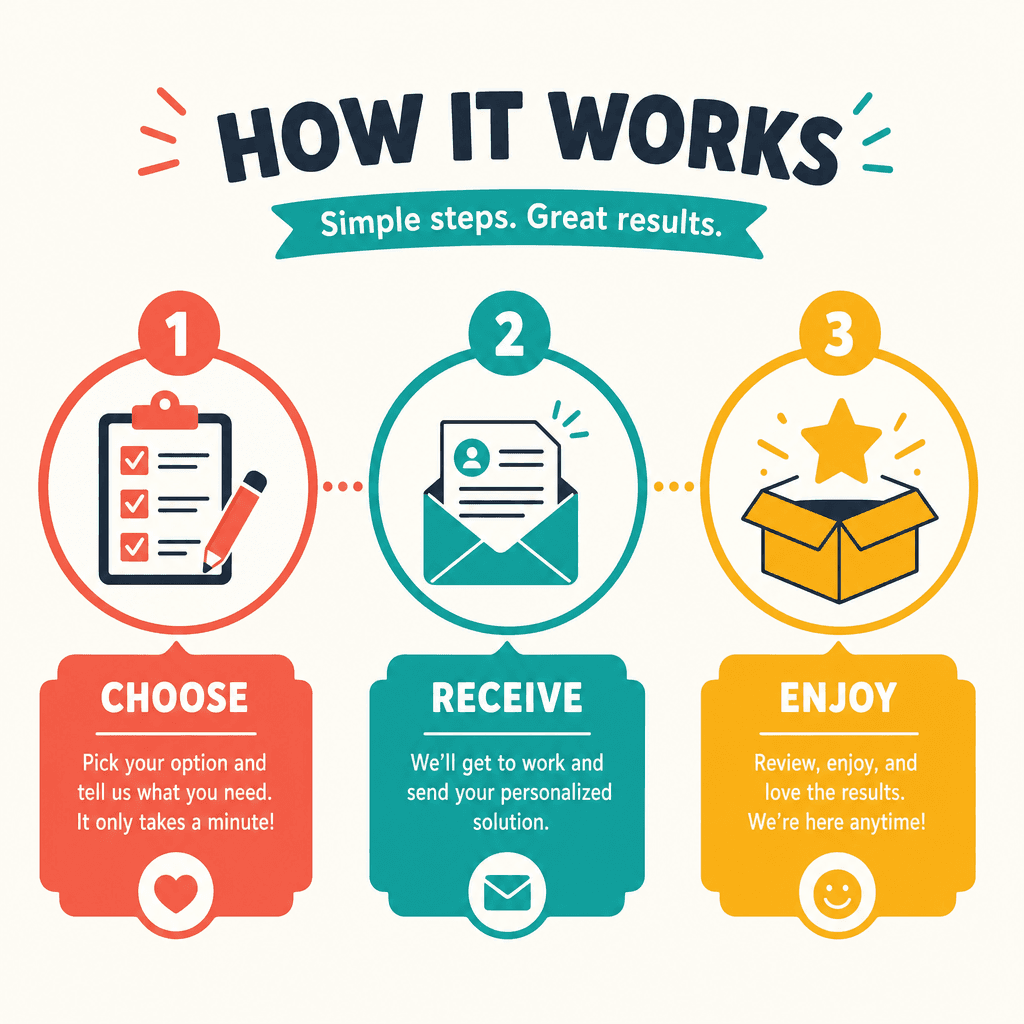
Prompt 17Flat vector how-it-works infographic, three numbered circular steps in a row connected by dotted lines, each with a simple icon and a decorative caption block. Bright even light, bold solid fills, friendly editorial style. Clear approachable mood, coral, teal, and amber on off-white. Square 1:1, balanced horizontal layout, sharp vector edges, generous whitespace, high resolution. 
Prompt 18Glossy 3D rendered bar chart on a dark gradient backdrop, smooth glowing bars of graduated height with soft reflective floor and gentle volumetric light. Shallow depth of field, subtle bloom, cinematic Octane render. Sleek high-tech mood, electric-cyan and magenta bars on deep navy. Centered composition, soft contact shadows. Square 1:1, premium data-viz presentation, high resolution, no legible text. 
Prompt 19Glossy 3D rendered pie chart floating above a soft gradient, thick beveled wedges in vivid colors with one slice pulled out, polished reflective surfaces. Soft studio softbox light, shallow depth of field, gentle glow. Clean modern mood, teal, coral, amber, and indigo wedges. Cinematic render, centered, soft shadow beneath. Square 1:1, premium data-viz mockup, high resolution. 
Prompt 20Dimensional 3D rendered network sphere, hundreds of glowing nodes connected by luminous threads forming a translucent globe of data, soft particles drifting. Dark backdrop, deep depth of field, cinematic bloom and rim light. Intelligent futuristic mood, cyan and violet glow on near-black. Centered composition, ethereal. Square 1:1, abstract data sculpture, high resolution. 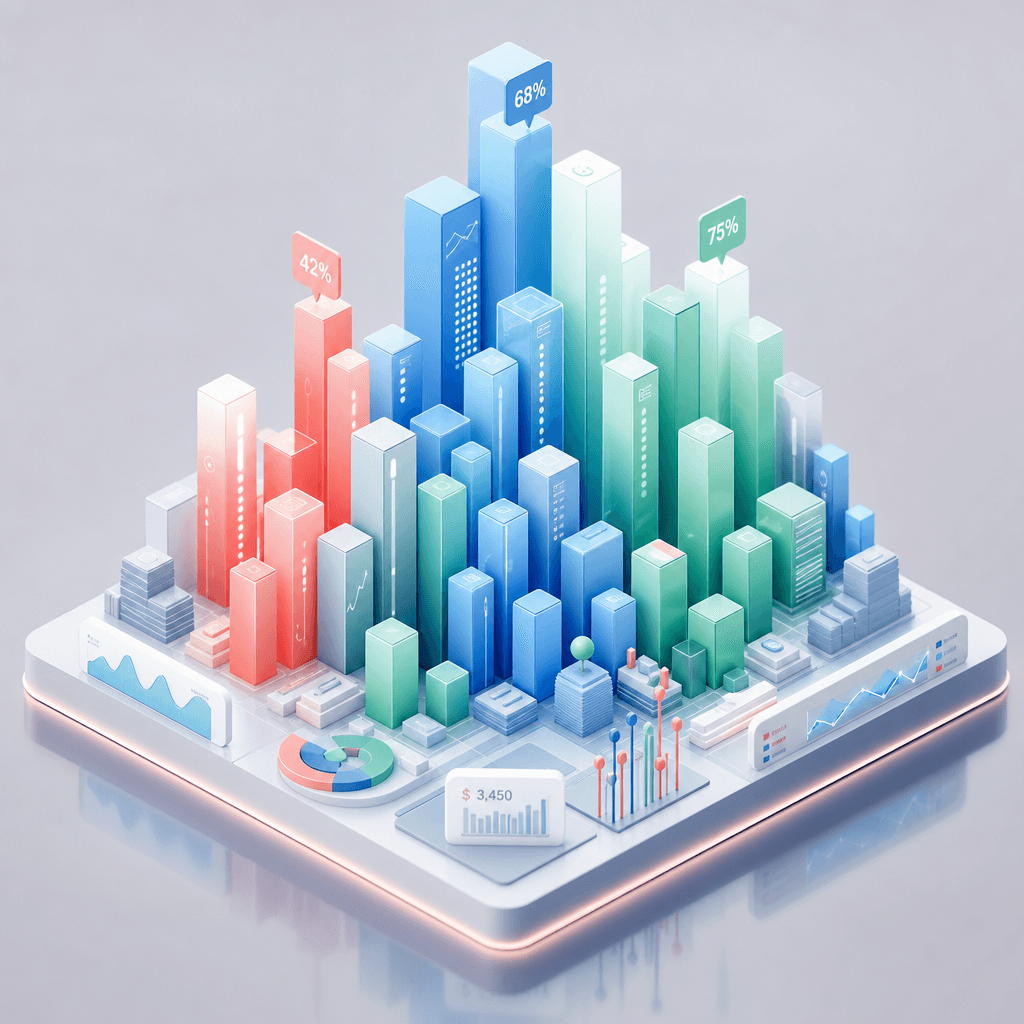
Prompt 21Isometric 3D rendered data city, a cluster of glowing bar-chart skyscrapers of varying heights on a clean platform, soft studio lighting and reflective base. Shallow depth of field, gentle ambient occlusion, cinematic render. Playful analytical mood, pastel-blue and mint towers with coral accents. Centered, soft shadows. Square 1:1, premium isometric data-viz, high resolution. 
Prompt 22Glossy 3D rendered globe with arcing data connections, a dark sphere wrapped in glowing flight-path arcs and pulsing point lights between continents. Deep space-like backdrop, soft bloom, cinematic depth of field. Global connected mood, electric-blue and teal arcs on midnight navy. Centered, subtle reflection. Square 1:1, premium global data-viz, high resolution. 
Prompt 23Dimensional 3D rendered line graph as a flowing ribbon, a smooth glossy ribbon rising and dipping over a faint grid floor with soft marker spheres. Studio light, shallow depth of field, gentle reflections and bloom. Dynamic sleek mood, gradient teal-to-violet ribbon on dark grey. Centered, soft shadow. Square 1:1, premium data-viz render, high resolution. 
Prompt 24Glossy 3D rendered bubble cluster, translucent glass spheres of varying size floating in a soft cluster catching colorful studio reflections. Soft gradient backdrop, shallow depth of field, dreamy bloom. Elegant abstract mood, iridescent teal, pink, and gold bubbles. Cinematic render, centered, gentle floor reflection. Square 1:1, premium data sculpture, high resolution. 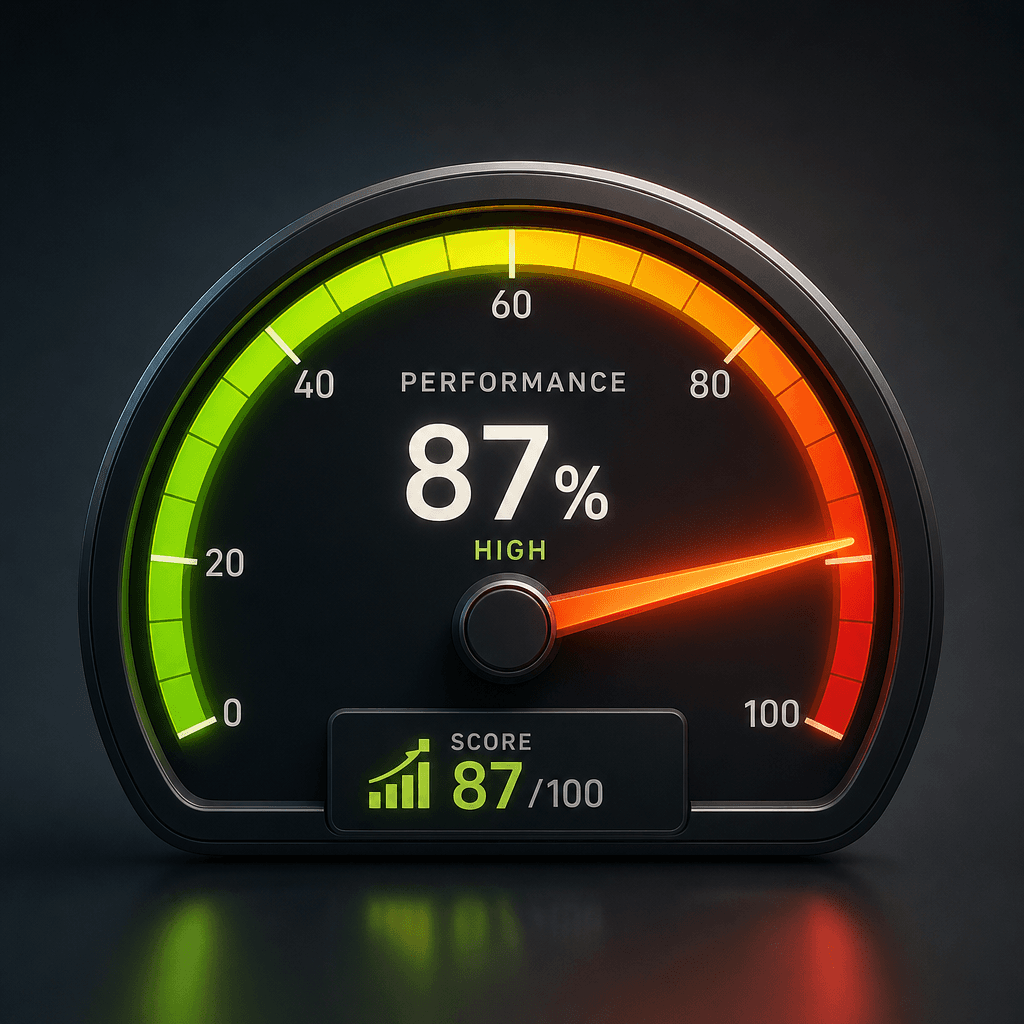
Prompt 25Dimensional 3D rendered gauge dashboard, a glossy semicircular speedometer-style dial with a glowing needle and beveled tick ring, soft reflective surface. Dark gradient backdrop, soft volumetric light, shallow depth of field. Performance-driven mood, lime-to-red arc on dark slate. Cinematic render, centered, soft shadow. Square 1:1, premium KPI data-viz, high resolution. 
Prompt 26Glossy 3D rendered funnel, four stacked translucent glass tiers narrowing downward with soft inner glow and liquid-like reflections. Clean gradient backdrop, shallow depth of field, gentle bloom. Polished conversion mood, indigo-to-cyan translucent tiers. Cinematic render, centered, soft contact shadow. Square 1:1, premium data-viz mockup, high resolution. 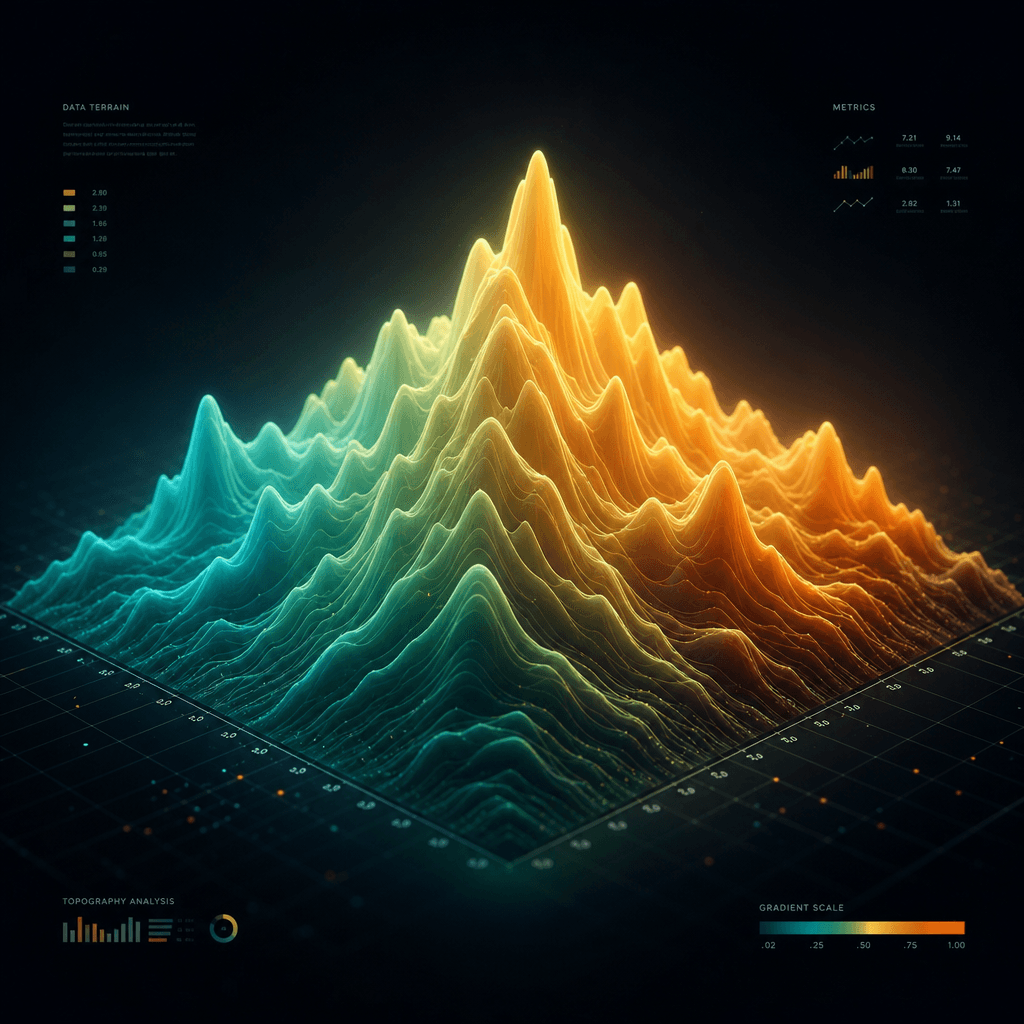
Prompt 27Dimensional 3D rendered area chart as a terrain, a smooth glowing mountainous surface rising from a dark grid plane, soft contour shading and volumetric light. Shallow depth of field, cinematic bloom. Epic analytical mood, teal-to-amber gradient terrain on near-black. Centered composition, soft glow. Square 1:1, abstract data landscape, high resolution. 
Prompt 28Glossy 3D rendered donut chart floating on a soft gradient, a thick beveled ring split into vivid glossy segments with a luminous center, polished reflections. Soft studio light, shallow depth of field, gentle glow. Clean modern mood, coral, teal, violet, and gold segments. Cinematic render, centered, soft shadow. Square 1:1, premium data-viz, high resolution. 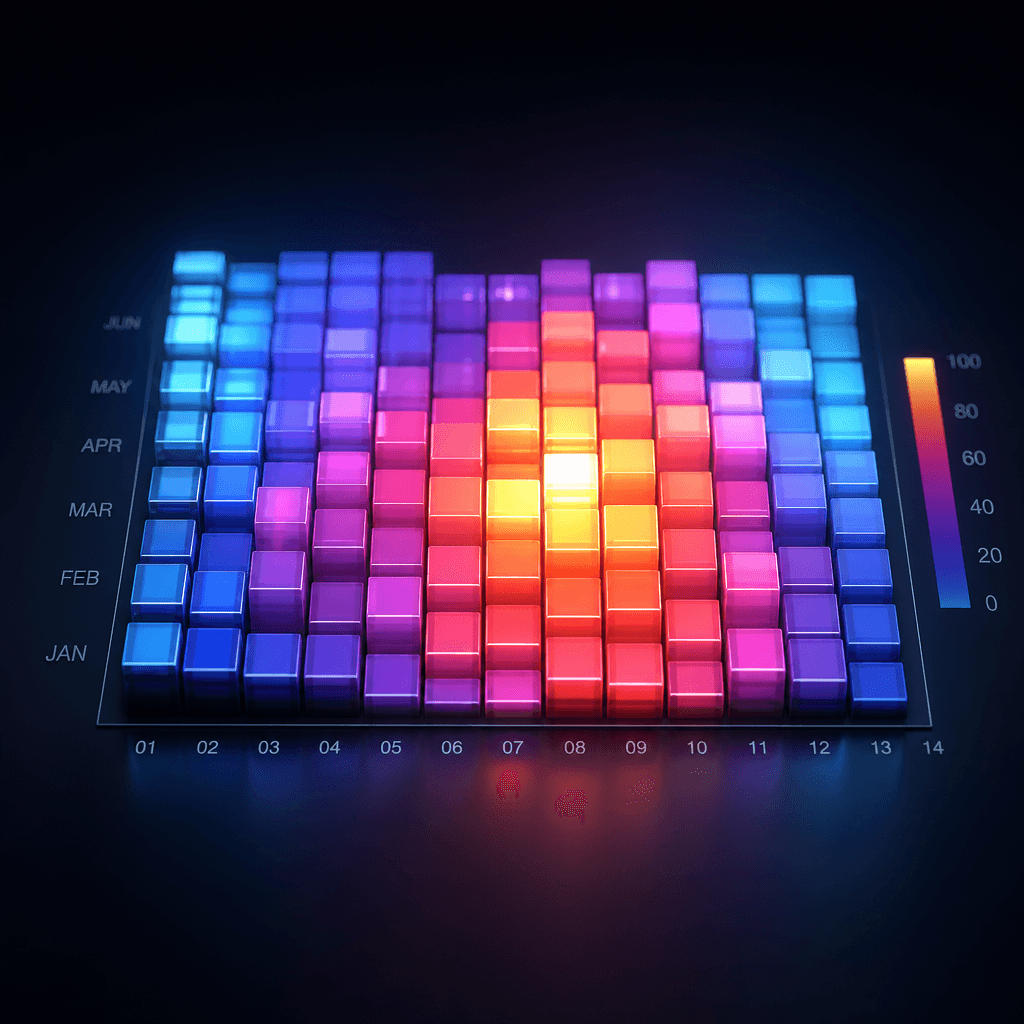
Prompt 29Dimensional 3D rendered heatmap grid, a tiled surface of glossy cells glowing at varying intensities like a luminous matrix, soft reflective floor. Dark backdrop, shallow depth of field, cinematic bloom. Data-rich technical mood, cool-blue to hot-magenta gradient cells. Centered, subtle perspective. Square 1:1, premium data-viz render, high resolution. 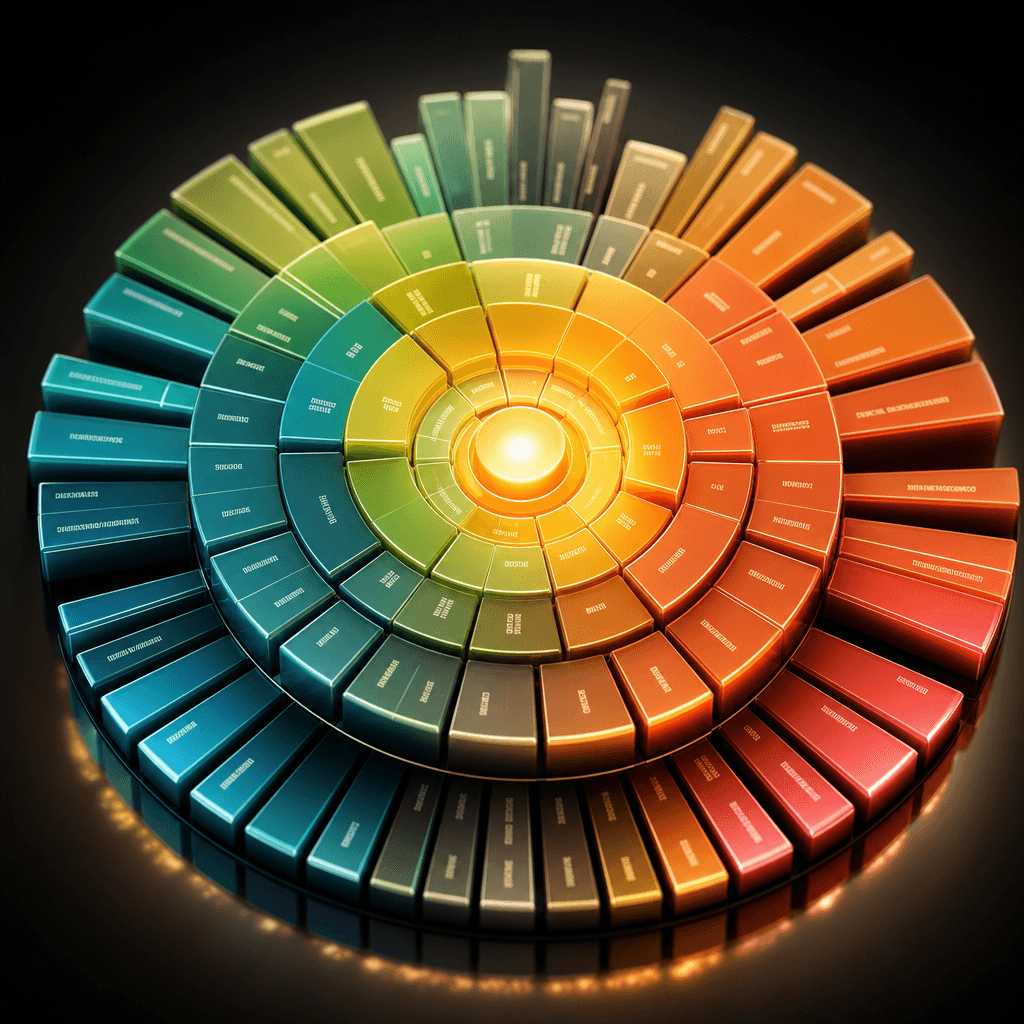
Prompt 30Glossy 3D rendered radial sunburst, concentric glowing rings split into beveled segments radiating from a luminous core, polished reflective base. Dark gradient backdrop, soft bloom, shallow depth of field. Elegant intricate mood, spectrum of teal, lime, amber, and coral. Cinematic render, centered. Square 1:1, premium hierarchical data-viz, high resolution. 
Prompt 31Dimensional 3D rendered candlestick stock chart, rows of glossy red and green floating candle bars over a faint grid with soft reflections and volumetric light. Dark backdrop, shallow depth of field, cinematic bloom. Tense financial mood, emerald-green and crimson on deep navy. Centered, soft shadow. Square 1:1, premium market data-viz, high resolution. 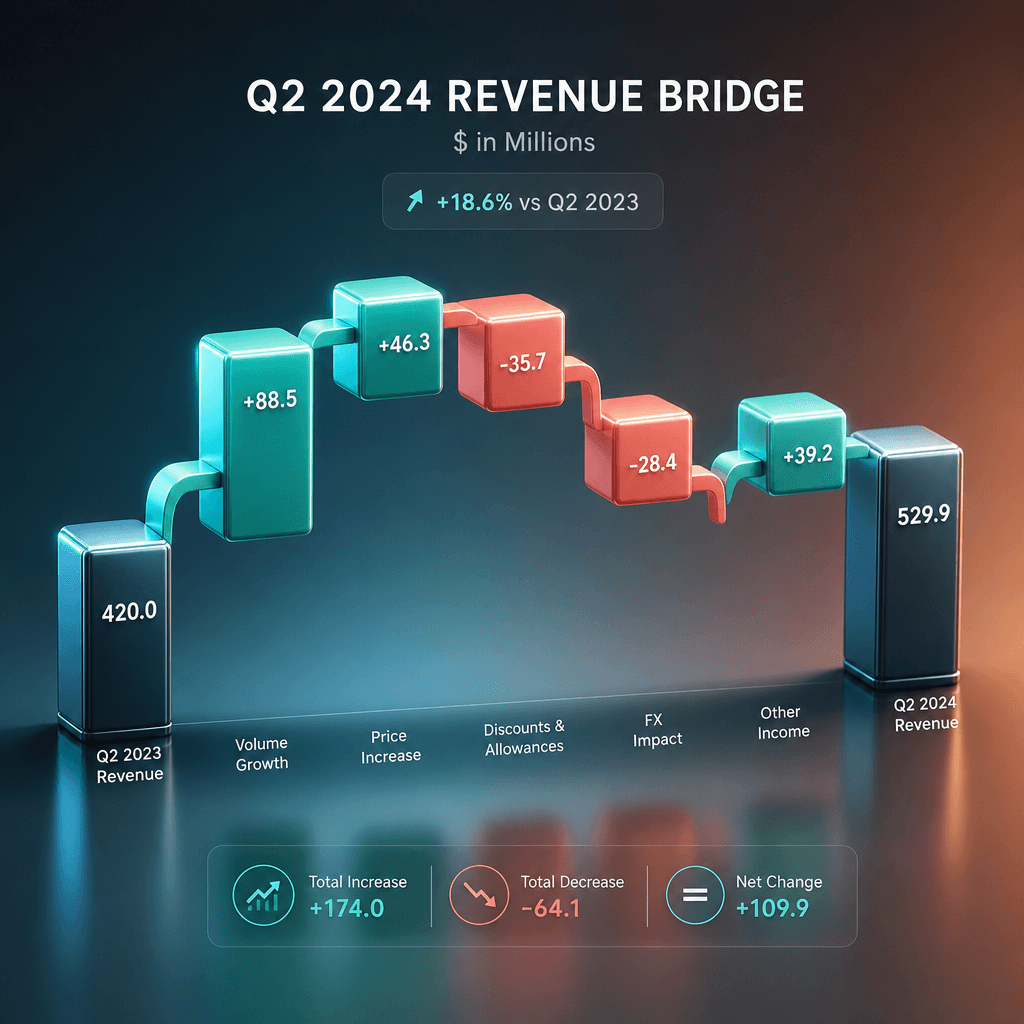
Prompt 32Glossy 3D rendered waterfall chart, a staggered series of floating beveled blocks stepping up and down with connector ribbons and soft reflections. Clean gradient backdrop, shallow depth of field, gentle glow. Structured analytical mood, teal rising blocks and coral falling blocks. Cinematic render, centered, soft shadow. Square 1:1, premium data-viz mockup, high resolution. 
Prompt 33Dimensional 3D rendered Sankey flow, glossy translucent ribbons splitting between glowing nodes in a smooth dimensional stream, soft reflective floor. Dark backdrop, shallow depth of field, cinematic bloom. Fluid systematic mood, teal-to-violet glowing ribbons on near-black. Centered, ethereal. Square 1:1, premium flow data-viz, high resolution. 
Prompt 34Glossy 3D rendered abstract data sculpture, an elegant arrangement of glowing rods, spheres, and arcs suggesting a multivariate dataset, soft particles drifting. Dark gradient backdrop, deep depth of field, cinematic rim light and bloom. Sophisticated futuristic mood, cyan, magenta, and gold accents. Centered composition. Square 1:1, premium abstract data art, high resolution. 
Prompt 35Photorealistic mockup of a colorful analytics dashboard glowing on a widescreen monitor on a tidy modern office desk. Soft daylight from a window, blurred plant and coffee mug beside it, gentle screen reflection, shallow depth of field. Focused professional mood, dark UI with teal and coral charts. Shot on a 50mm lens. Square 1:1, business data-viz lifestyle shot, high resolution. 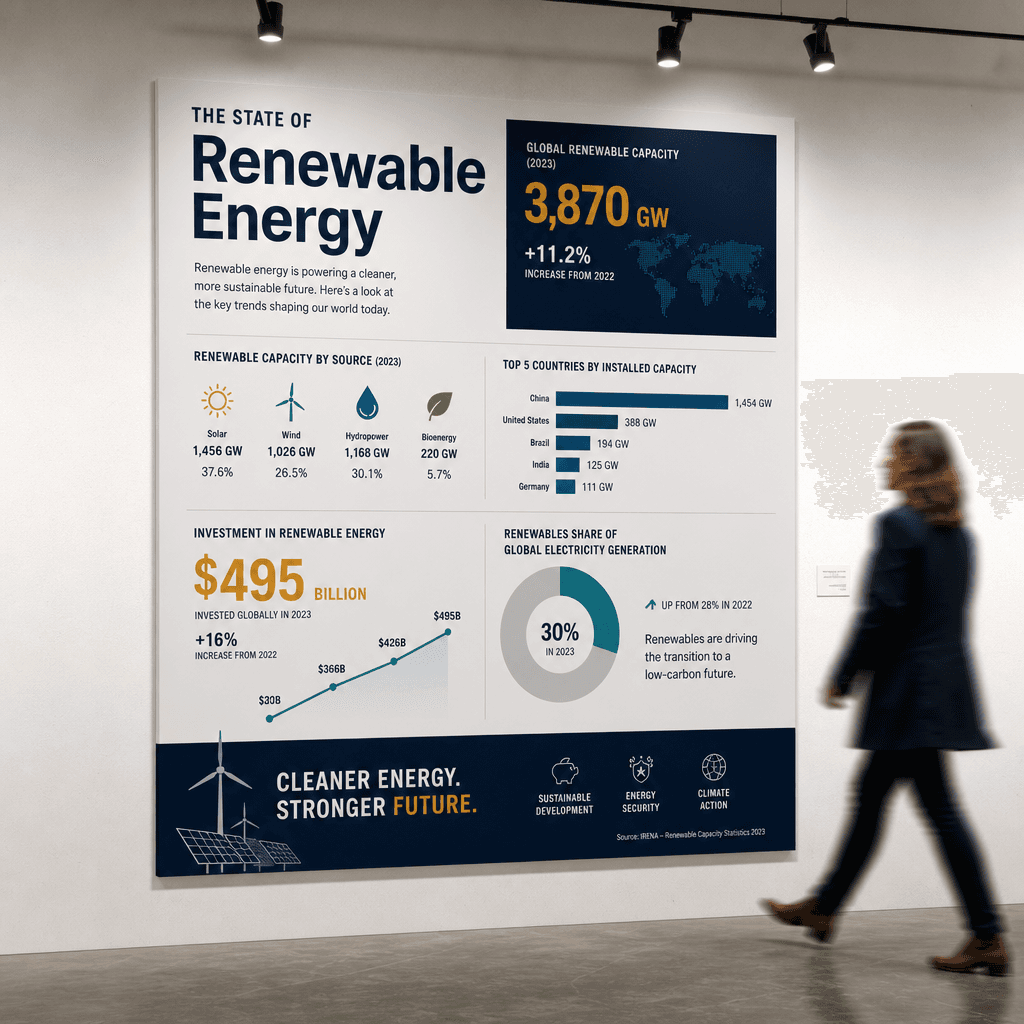
Prompt 36Photorealistic mockup of a large infographic poster mounted on a clean gallery wall, bold charts and stat blocks under soft track lighting, a person blurred walking past. Shallow depth of field, subtle wall texture. Editorial confident mood, navy, teal, and amber on white. Shot on a 35mm lens. Square 1:1, printed infographic presentation, high resolution. 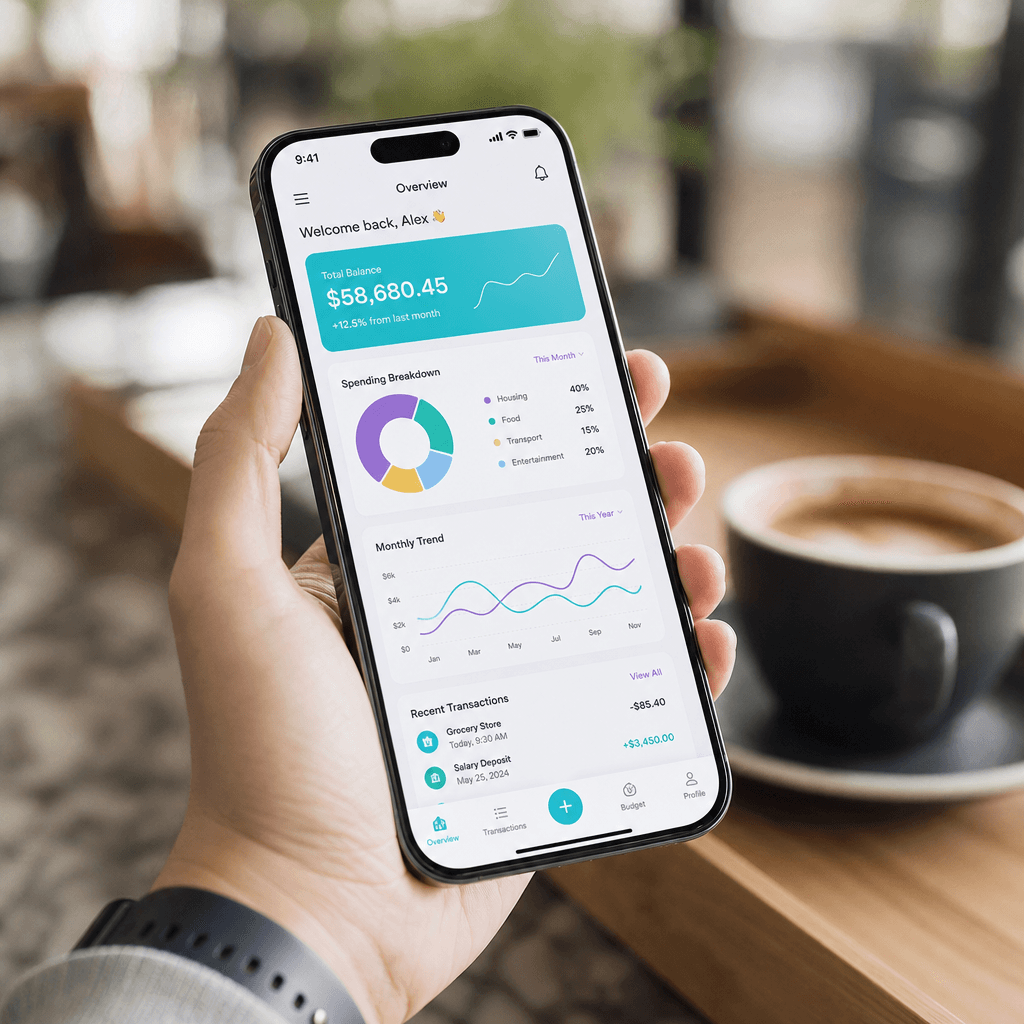
Prompt 37Photorealistic mockup of a smartphone held in a hand showing a sleek stats dashboard, colorful charts on screen with crisp reflection, blurred cafe background. Soft daylight, shallow depth of field. Everyday modern mood, clean light UI with teal and violet accents. Shot on a 50mm lens, lifestyle photography. Square 1:1, app data-viz shot, high resolution. 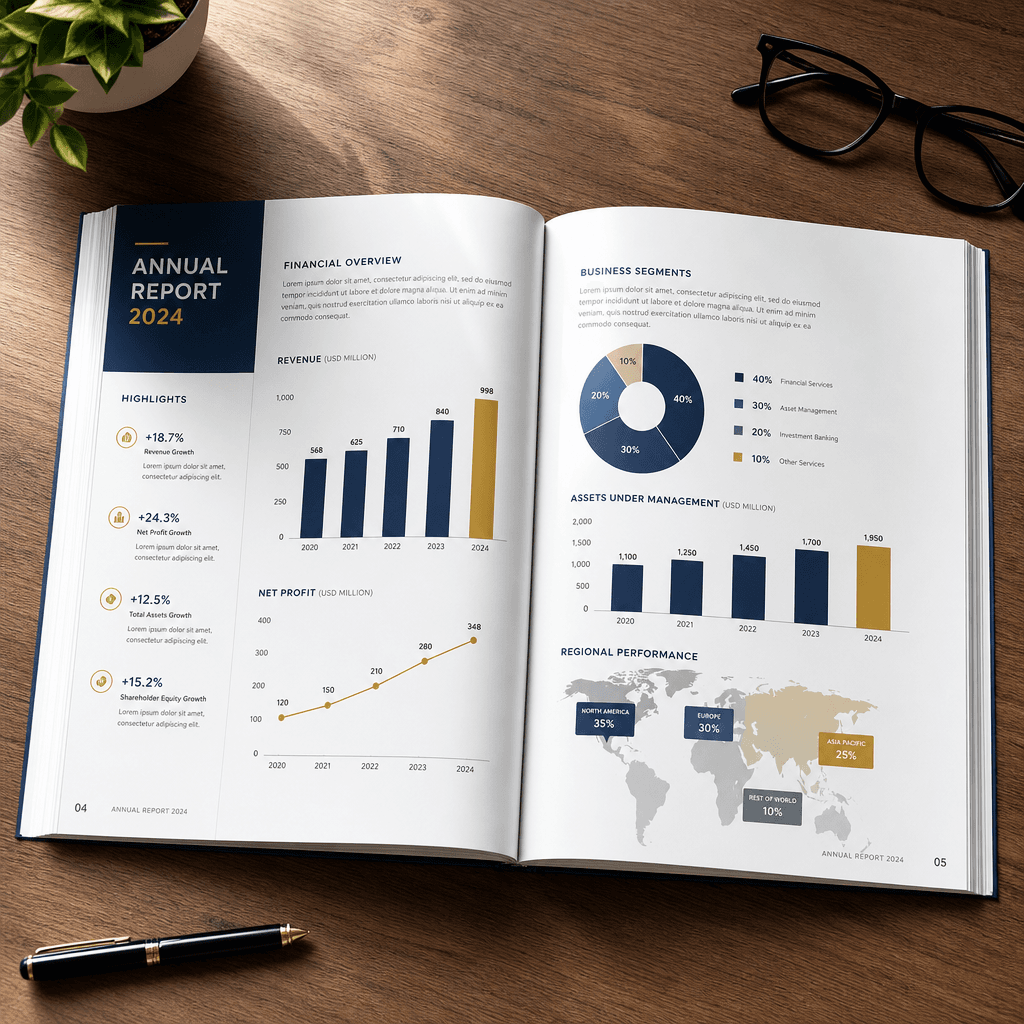
Prompt 38Photorealistic mockup of a printed annual report open on a wooden desk, a glossy two-page spread of charts and infographics, pen and glasses beside it. Soft warm daylight, shallow depth of field, gentle page shadow. Corporate refined mood, navy and gold data graphics on white paper. Shot on a 50mm lens, top-down angle. Square 1:1, high resolution. 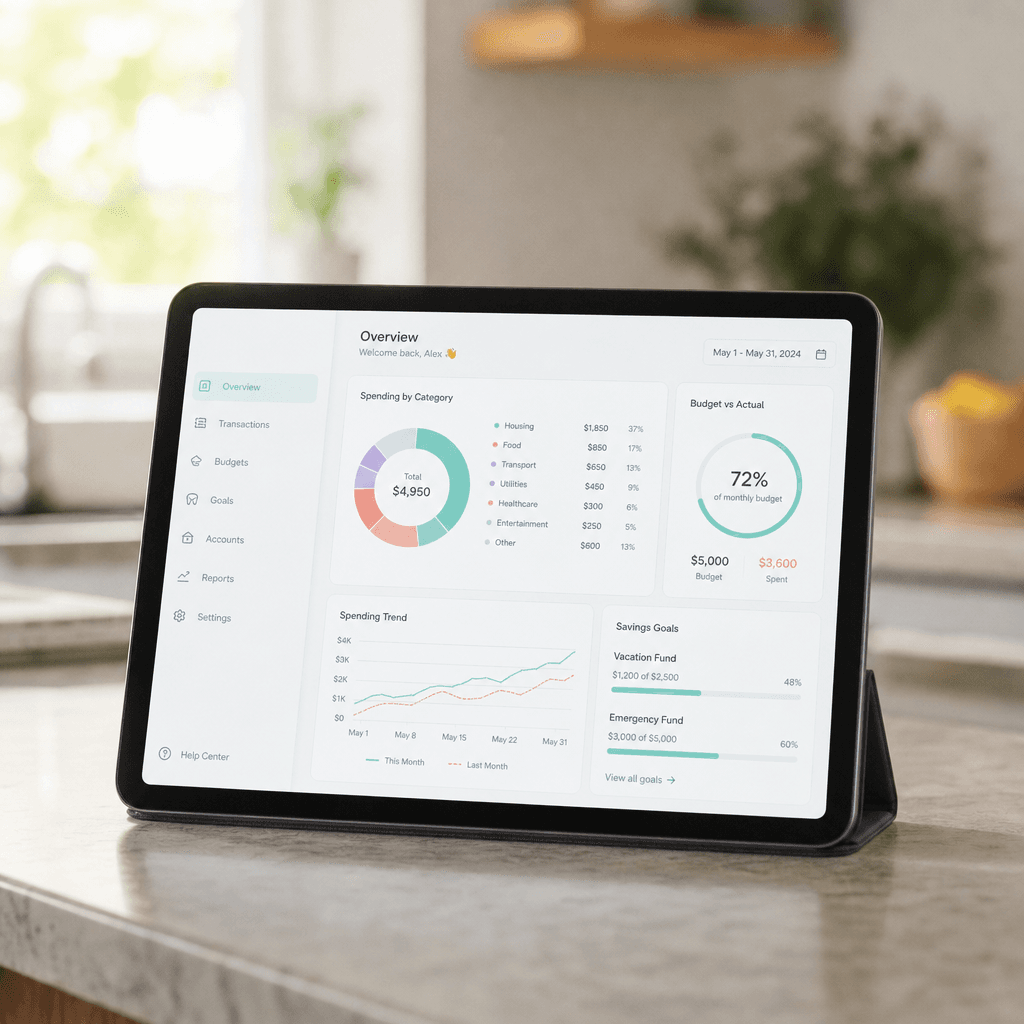
Prompt 39Photorealistic mockup of a tablet propped on a kitchen counter showing a clean dashboard of rings and charts, blurred morning light behind. Soft daylight, crisp screen, shallow depth of field. Calm modern mood, pastel UI with mint and coral data. Shot on a 50mm lens, lifestyle photography. Square 1:1, dashboard data-viz shot, high resolution. 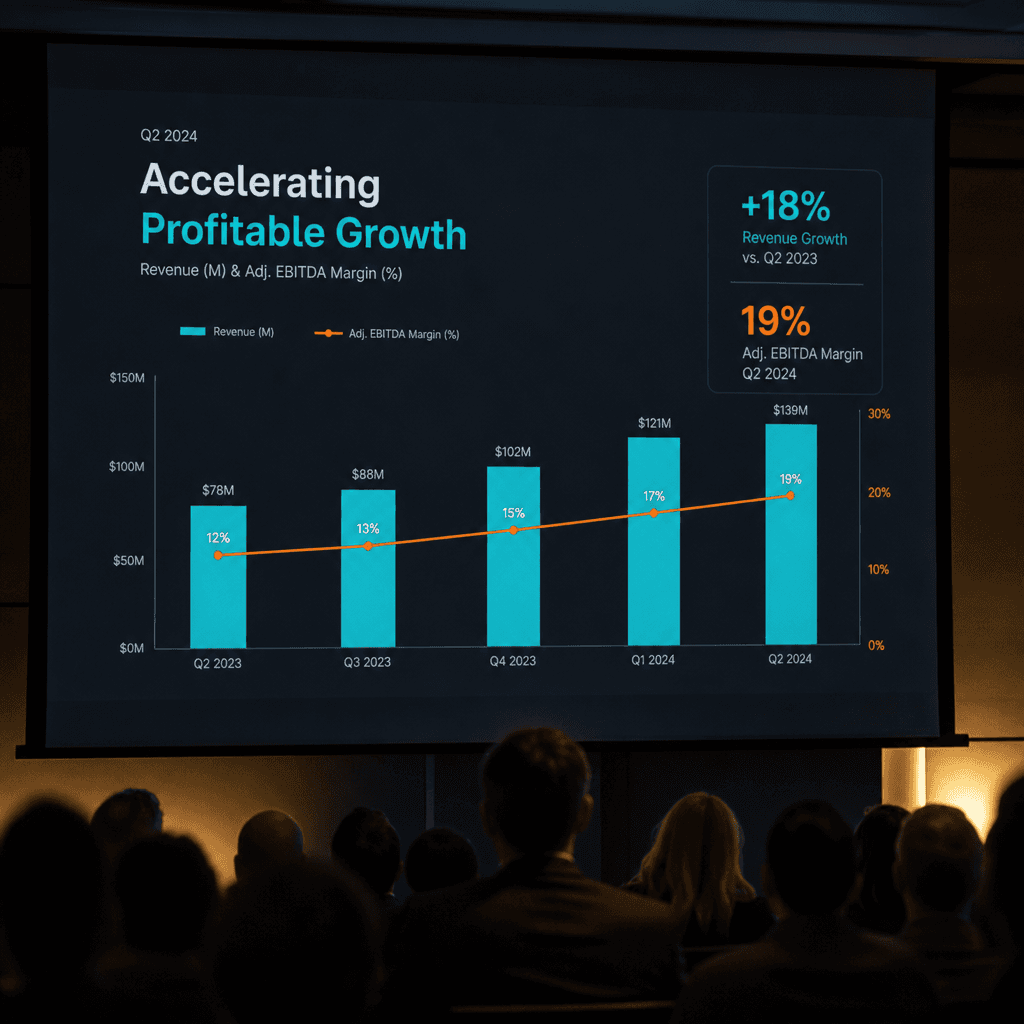
Prompt 40Photorealistic mockup of a presentation slide projected on a large screen in a dim meeting room, a bold bar-and-line chart glowing, blurred silhouettes of an audience. Soft projector glow, shallow depth of field. Professional decisive mood, dark slide with cyan and orange charts. Shot on a 35mm lens. Square 1:1, keynote data-viz scene, high resolution. 
Prompt 41Photorealistic mockup of a giant interactive data wall in a sleek control room, multiple glowing charts and a world map across curved screens, a person silhouetted before it. Cool ambient light, shallow depth of field, soft reflections. High-tech commanding mood, blue and teal dashboards on dark. Shot on a 24mm lens. Square 1:1, high resolution. 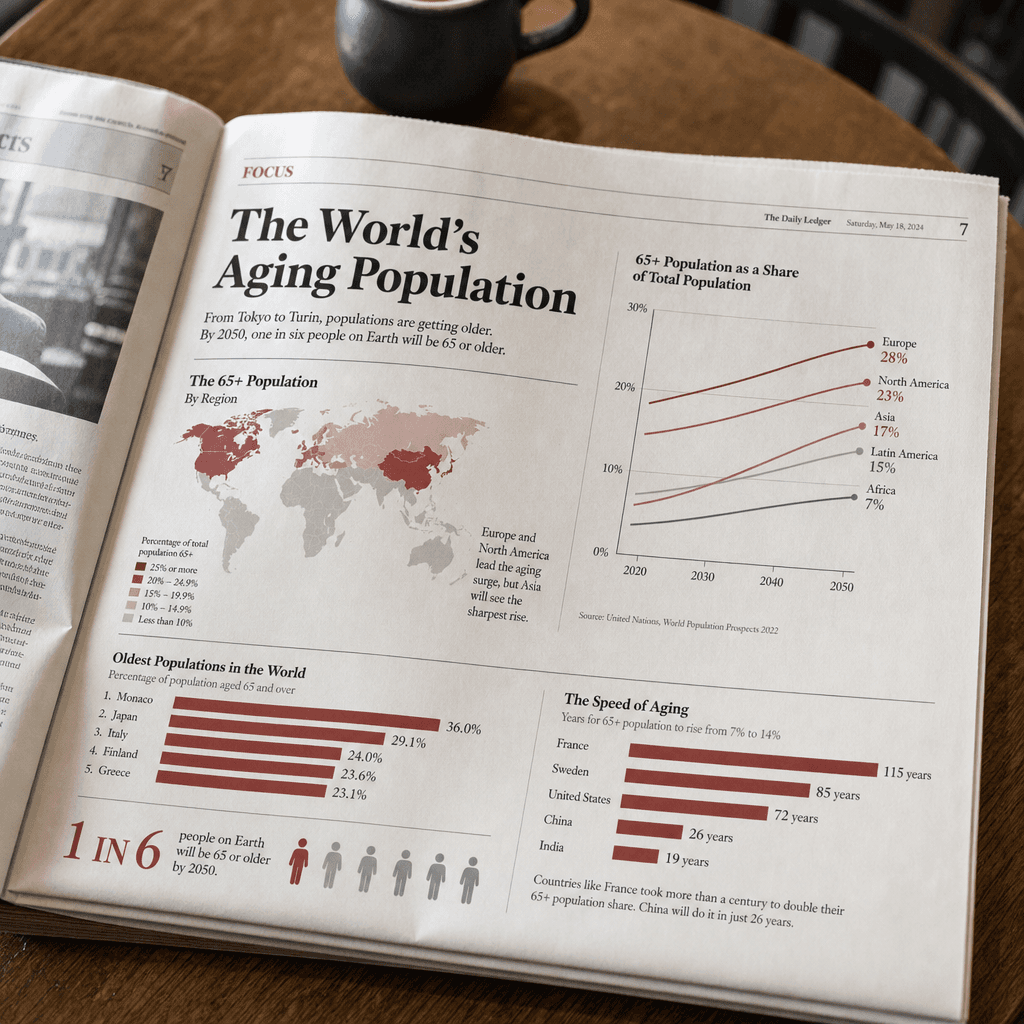
Prompt 42Photorealistic mockup of a folded newspaper on a cafe table opened to a data-journalism infographic page, crisp printed charts in muted ink. Soft morning light, blurred coffee cup behind, shallow depth of field. Classic editorial mood, black, red, and slate on newsprint. Shot on a 50mm lens, top-down. Square 1:1, print infographic presentation, high resolution. 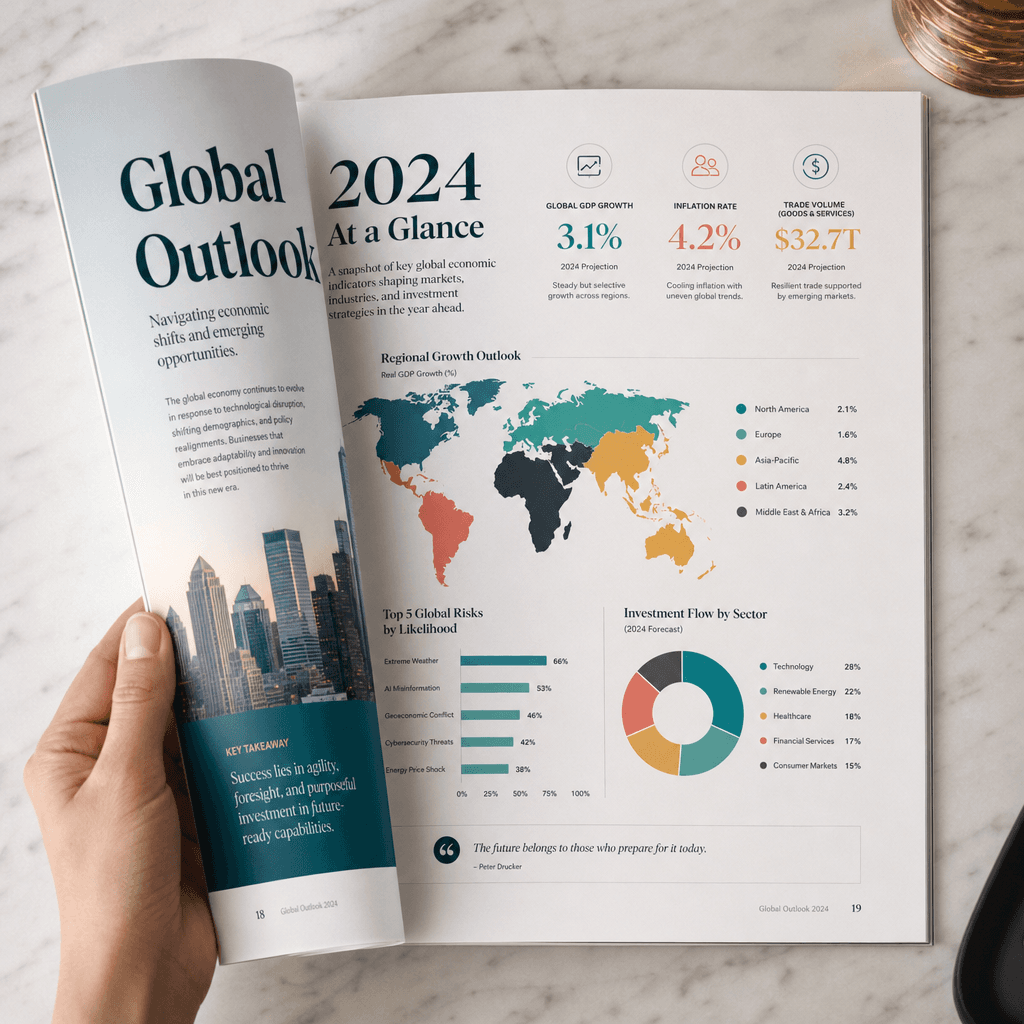
Prompt 43Photorealistic mockup of a glossy magazine spread on a marble table showing a full-page data visualization, vivid charts on coated paper, a hand turning the page. Soft diffused daylight, shallow depth of field. Premium editorial mood, teal, coral, and gold graphics on white. Shot on a 50mm lens, top-down angle. Square 1:1, high resolution. 
Prompt 44Photorealistic mockup of a trading desk with a curved triple-monitor setup of live market charts, candlesticks and tickers glowing in a dim room. Cool screen light, shallow depth of field, soft reflections. Intense focused mood, green and red charts on black UI. Shot on a 35mm lens. Square 1:1, finance data-viz scene, high resolution. 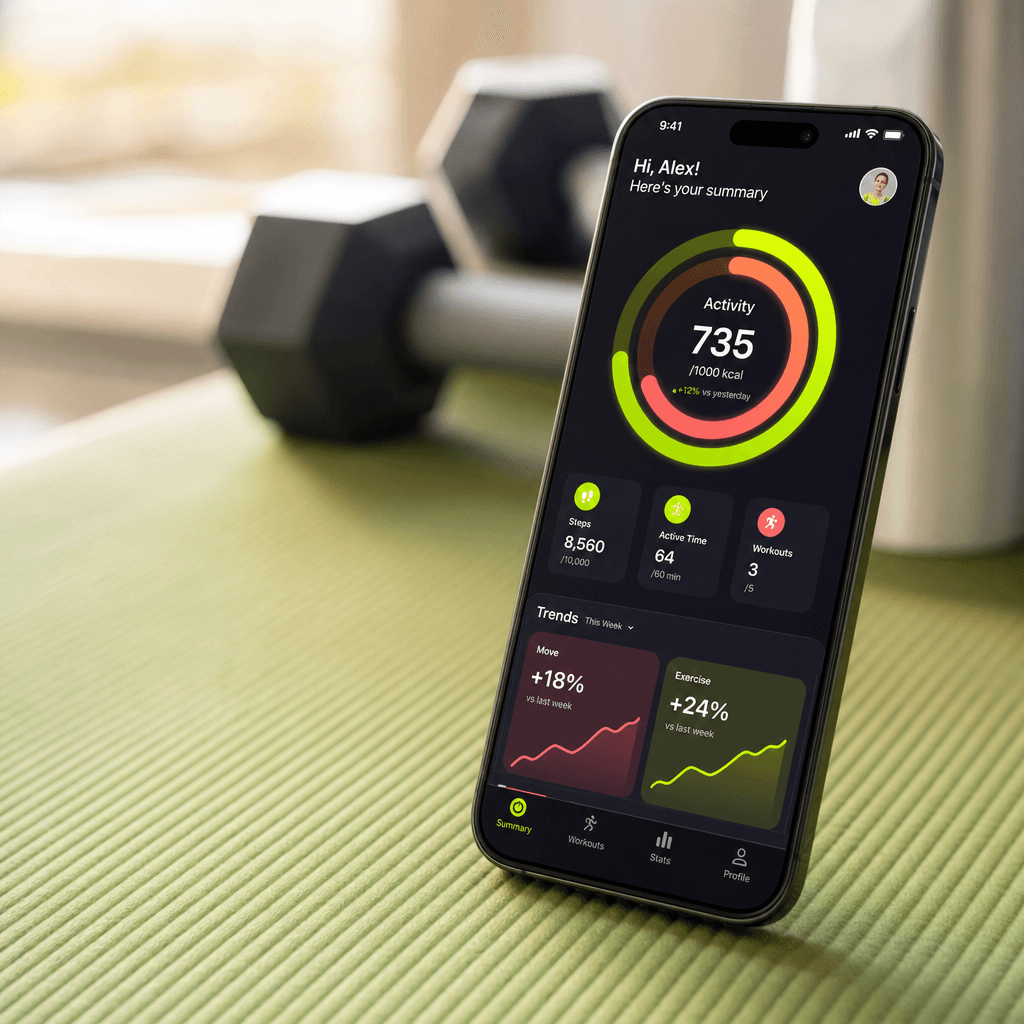
Prompt 45Photorealistic mockup of a fitness app on a smartphone resting on a yoga mat, showing colorful activity rings and trend charts, blurred dumbbells behind. Bright soft daylight, crisp screen, shallow depth of field. Energetic healthy mood, vibrant gradient UI with lime and coral. Shot on a 50mm lens, lifestyle photography. Square 1:1, high resolution. 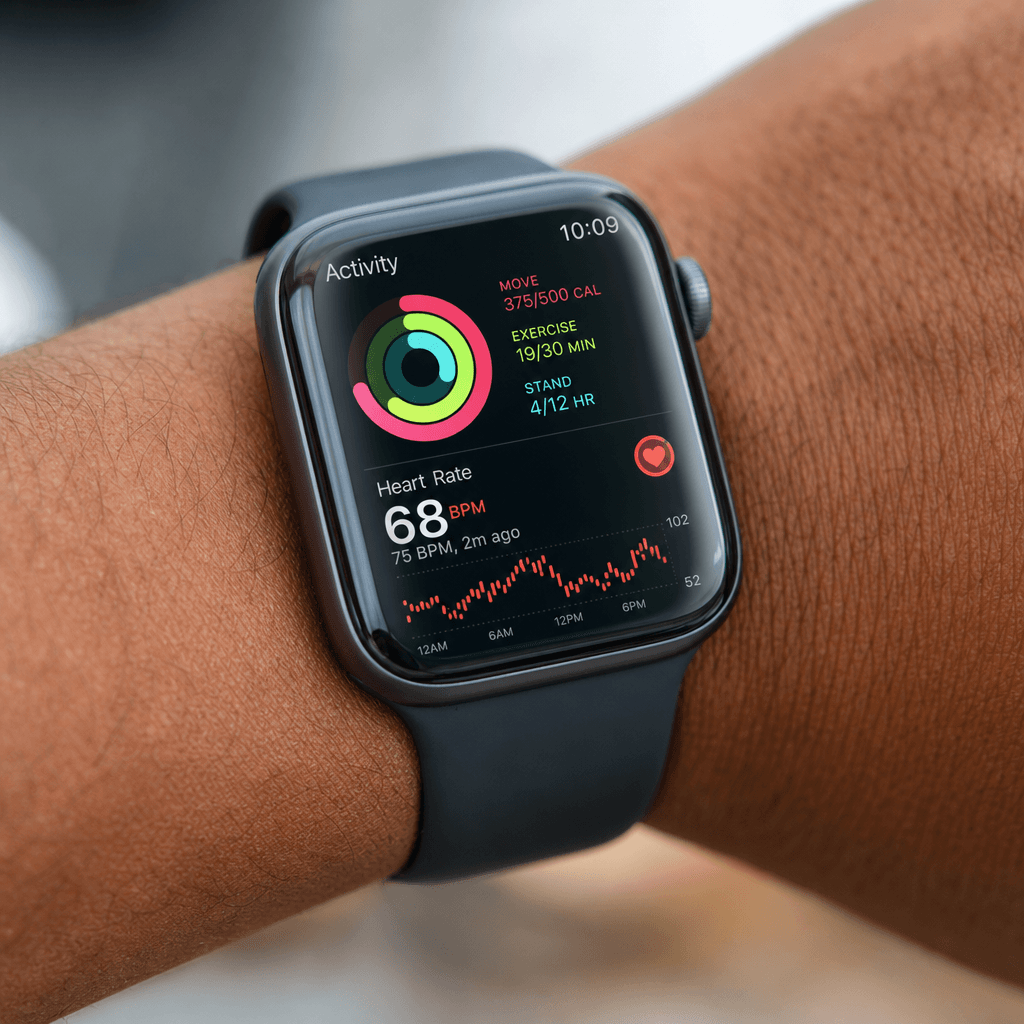
Prompt 46Photorealistic macro mockup of a smartwatch on a wrist showing glowing health rings and a heart-rate graph, fine screen detail and soft skin tones. Soft natural light, very shallow depth of field, gentle bokeh. Personal modern mood, vivid rings on a dark watch face. Shot on a 90mm macro lens. Square 1:1, wearable data-viz closeup, high resolution. 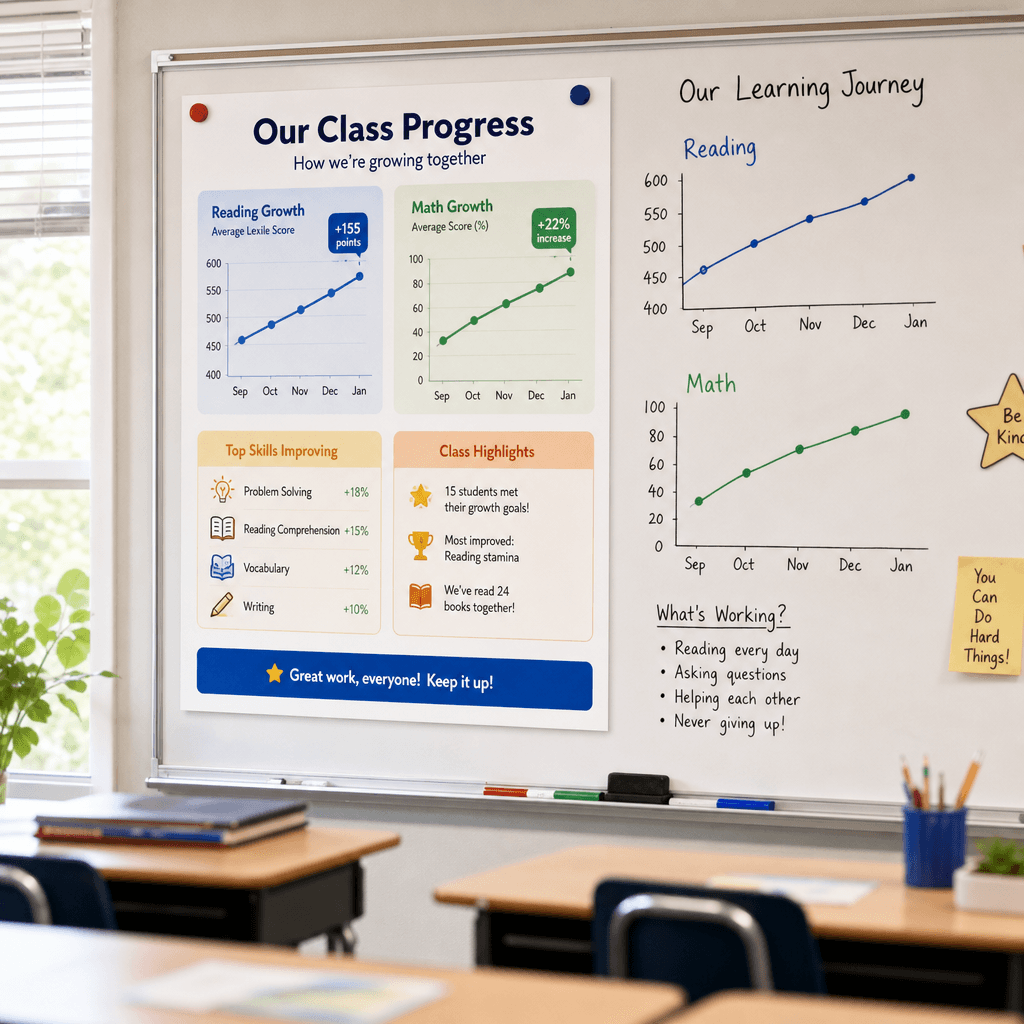
Prompt 47Photorealistic mockup of a classroom whiteboard with a large printed infographic poster beside hand-drawn chart notes, soft daylight from windows. Blurred desks in foreground, shallow depth of field. Educational friendly mood, primary colors on white. Shot on a 35mm lens. Square 1:1, learning data-viz scene, high resolution. 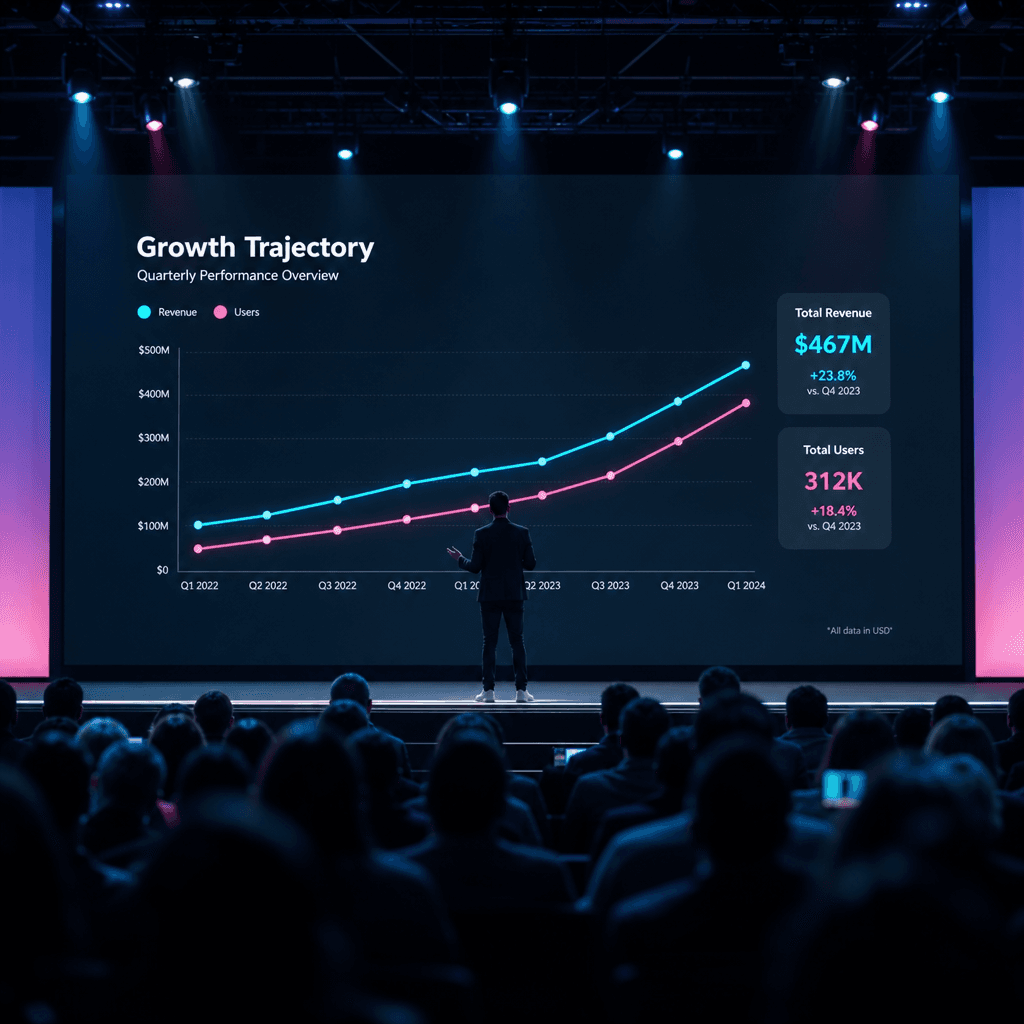
Prompt 48Photorealistic mockup of a conference keynote stage with a presenter silhouetted before a huge screen displaying a glowing line chart, dramatic stage lighting and audience bokeh. Shallow depth of field. Impressive professional mood, dark screen with cyan and magenta data. Shot on a 70-200mm lens. Square 1:1, event data-viz scene, high resolution. 
Prompt 49Photorealistic mockup of a laptop on a cozy home desk showing a colorful project dashboard, warm lamp light, blurred notebook and plant beside it. Soft evening glow, crisp screen reflection, shallow depth of field. Focused relaxed mood, clean light UI with teal and amber charts. Shot on a 50mm lens, lifestyle photography. Square 1:1, high resolution. 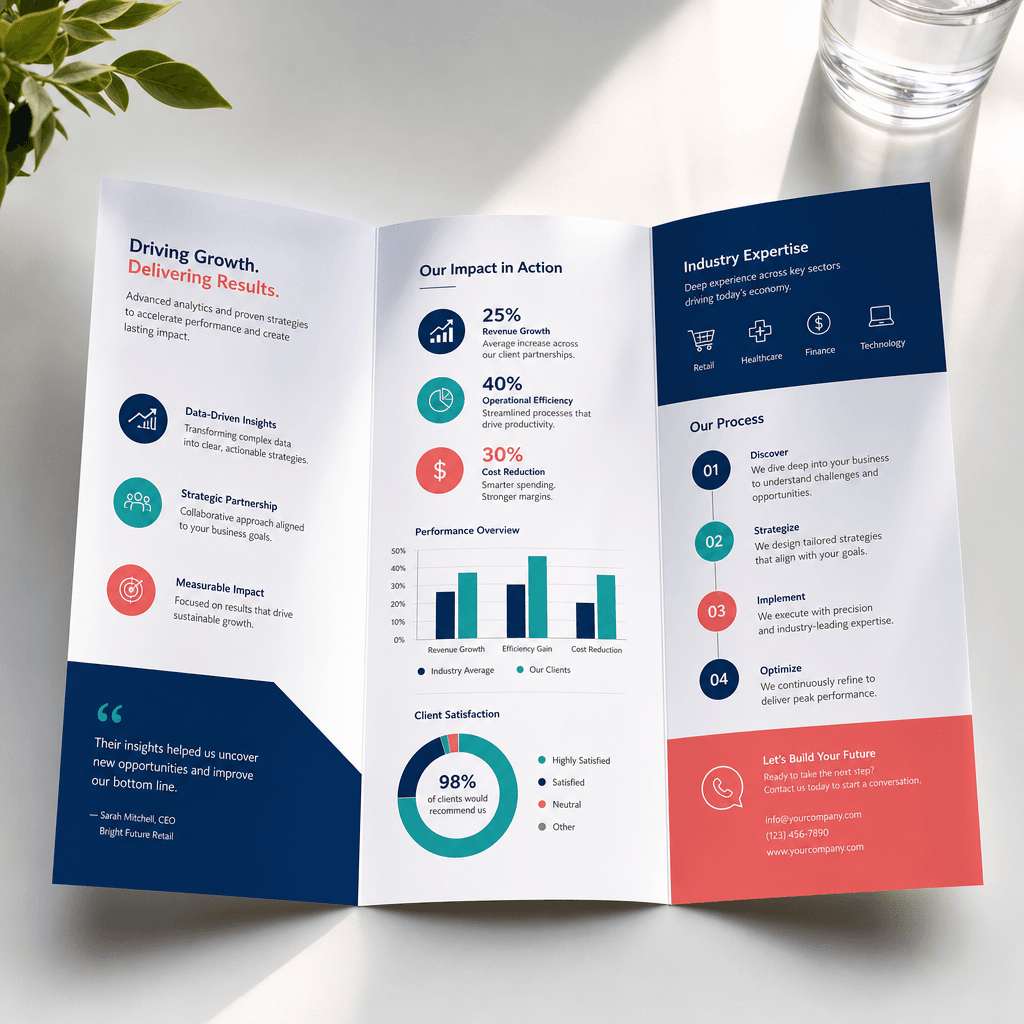
Prompt 50Photorealistic mockup of a tri-fold brochure unfolded on a light table, glossy printed infographic panels of charts and icons, soft directional daylight and gentle paper shadows. Shallow depth of field. Polished marketing mood, navy, teal, and coral on white stock. Shot on a 50mm lens, top-down angle. Square 1:1, print data-viz presentation, high resolution.